Q2 2023 Quarterly Market Commentary

Markets Have Fantastic Second Quarter

Global equity markets had a fantastic second quarter – especially the tech names. But toward the end of the quarter, the rally really started to broaden out, as underscored by the large-cap S&P 500 recording its biggest quarterly gain since late 2021.

For the second quarter of 2023:

  • The DJIA advanced 3.4%;

  • The S&P 500 gained 8.3%;

  • NASDAQ jumped 13.1%; and

  • The Russell 2000 added 4.8%.

Besides there being a lot to celebrate when the quarter closed, investors were also paying attention to the year’s mid-way point as:

  • The S&P 500 is up more than 16% YTD and turned in its best first half since 2019;

  • NASDAQ is up an astonishing 31%+ YTD on its way to its best half since 1983; and

  • The DJIA turned in a much more modest 3.9% YTD gain.

The themes that drove market performance in the second quarter continued to center around inflation, the Fed, and the labor market, as recent numbers suggested that inflation is easing as the Fed paused its rate-hiking trend (at least for now). There was also a lot of encouraging economic data received this quarter as well, including a revised GDP number.

Further, we saw that:

  • Volatility, as measured by the VIX, trended down this quarter, beginning the quarter at 18.70 and ending at 13.59, never breaching its beginning-of-the-quarter high.

  • West Texas Intermediate crude also trended down for the quarter, starting at just over $75.57/barrel and ending the quarter at $70.45, with a brief spike early in the quarter to more than $83/barrel.

Market Performance Around the World

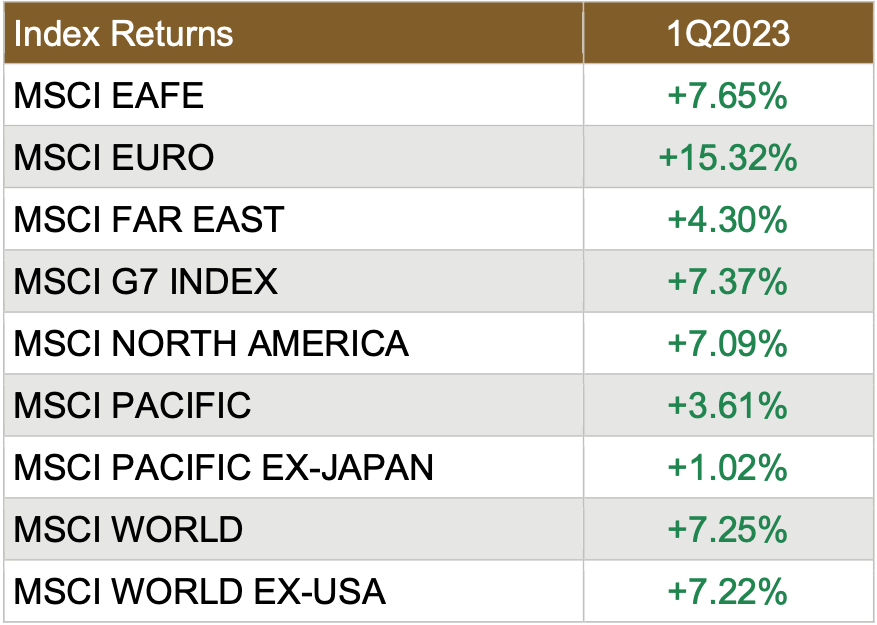
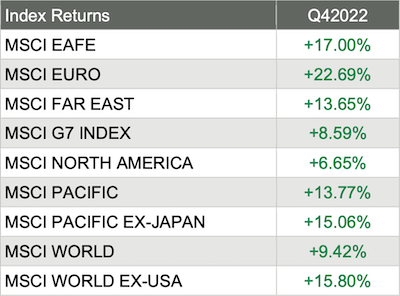
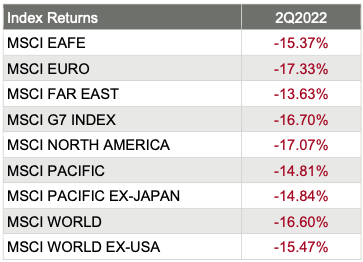
Investors were happy with the quarterly performance around the world, as all 32 of the 36 developed markets tracked by MSCI were positive for the second quarter of 2023, with 13 jumping more than 6%. And for the 40 developing markets tracked by MSCI, only 23 of those were positive, although 2 leapt more than 15% (MSCI Eastern Europe and MSCI Eastern Europe ex-Russia).

Source: MSCI. Past performance cannot guarantee future results

Sector Performance Rotated in 2Q2023

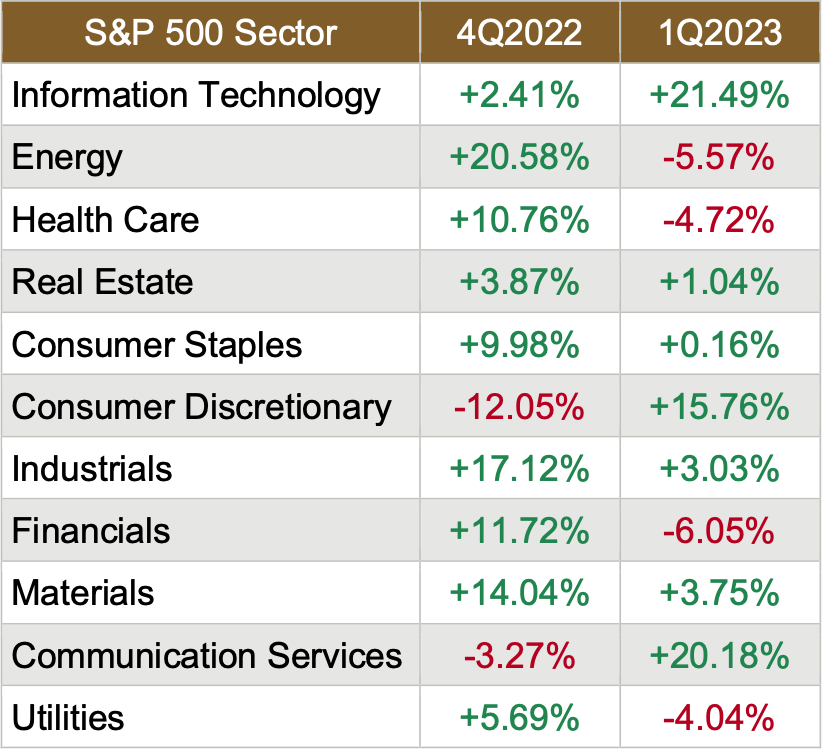
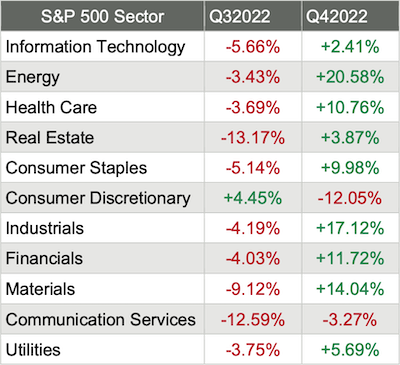
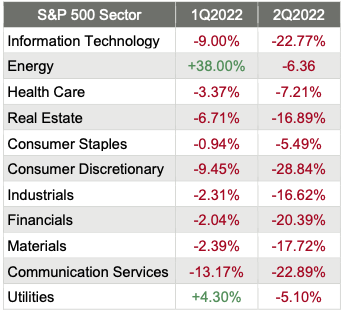
The overall performance for sector performance for the second quarter of 2023 was very good, as 9 of the 11 sectors advanced, with 3 jumping more than 15% . Compared to last quarter’s performance, this quarter was much better, as last quarter saw only 7 painted green.

And interestingly, this past quarter was eerily similar to the 4th quarter of last year, which also saw 9 advance, including 6 of those jumping by double-digits. Here are the sector returns for the second and first quarters of 2023:

Source: FMR

Reviewing the sector returns for just the 2nd quarter of 2023, we saw that:

  • 9 of the 11 sectors were painted green, with the Information Technology and Consumer Discretionary sectors making big leaps;

  • The defensive-sectors (think Utilities and Energy) struggled during the quarter;

  • Financials rebounded on the heels of last quarter’s struggles which were driven by two significant bank failures; and

  • The differences between the best (+20%) performing and worst (-2%) performing sectors in the first quarter was massive.

1Q2023 GDP Revised Up

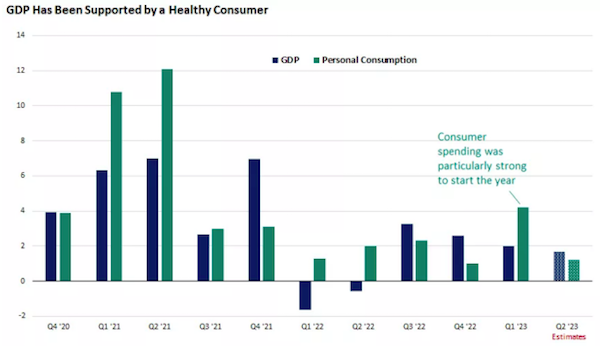
As the quarter came to a close, the Bureau of Economic Analysis reported that real gross domestic product (GDP) increased at an annual rate of 2.0% in the first quarter of 2023. In the fourth quarter, real GDP increased 2.6%.

Here is one of the more interesting – and surprising – revelations from the BEA’s press release:

“The GDP estimate released today is based on more complete source data than were available for the "second" estimate issued last month. In the second estimate, the increase in real GDP was 1.3%. The updated estimates primarily reflected upward revisions to exports and consumer spending that were partly offset by downward revisions to nonresidential fixed investment and federal government spending. Imports, which are a subtraction in the calculation of GDP, were revised down.”

Further:

“The increase in real GDP in the first quarter reflected increases in consumer spending, exports, state and local government spending, federal government spending, and nonresidential fixed investment that were partly offset by decreases in private inventory investment and residential fixed investment. Imports increased.

Compared to the fourth quarter, the deceleration in real GDP in the first quarter primarily reflected a downturn in private inventory investment and a slowdown in nonresidential fixed investment that were partly offset by an acceleration in consumer spending, an upturn in exports, and a smaller decrease in residential fixed investment. Imports turned up.

  • Current-dollar GDP increased 6.1% at an annual rate, or $391.8 billion, in the first quarter to a level of $26.53 trillion, an upward revision of $43.5 billion from the previous estimate.

  • The price index for gross domestic purchases increased 3.8% in the first quarter, the same as the previous estimate.

  • The personal consumption expenditures (PCE) price index increased 4.1%, revised down 0.1%. The PCE price index excluding food and energy prices increased 4.9%, a downward revision of 0.1%.

    Personal Income

  • Current-dollar personal income increased $278.0 billion in the first quarter, an upward revision of $26.7 billion from the previous estimate. The increase primarily reflected increases in compensation (led by private wages and salaries) and personal current transfer receipts (led by government social benefits).

  • Disposable personal income increased $587.9 billion, or 12.9 percent, in the first quarter, an upward revision of $26.4 billion from the previous estimate. Real disposable personal income increased 8.5%, an upward revision of 0.7%.

  • Personal saving was $840.9 billion in the first quarter, an upward revision of $11.6 billion from the previous estimate.

  • The personal saving rate – personal saving as a percentage of disposable personal income – was 4.3% in the first quarter, an upward revision of 0.1%.”

Source: Bloomberg, Atlanta Fed GDPNow Estimates

Fed Keeps Rates Steady

Late in the quarter, the Federal Reserve announced that they would hold the official federal funds target rate to the 5.00% to 5.25% range, the first pause after 10 hikes in 14 months. But Wall Street is still betting on two more rate hikes before the year is over.

Fed Chair Jerome Powell then said multiple times that the policy committee had not made any decision about raising rates and that “any further moves would depend on incoming growth and inflation data.” This statement was interpreted as more dovish.

Then Powell said: “We've moved much closer to our destination, which is that sufficiently restrictive rate, and I think that means by almost by definition that the risks of sort of overdoing it and…underdoing it are getting closer to being in balance.”

Inflation Slows, But Core-Inflation a Worry

The U.S. Bureau of Labor Statistics reported that the Consumer Price Index for All Urban Consumers rose 0.1% in May on a seasonally adjusted basis, after increasing 0.4% in April. Over the last 12 months, the all items index increased 4.0% before seasonal adjustment.

“The index for shelter was the largest contributor to the monthly all items increase, followed by an increase in the index for used cars and trucks. The food index increased 0.2 percent in May after being unchanged in the previous 2 months. The index for food at home rose 0.1 percent over the month while the index for food away from home rose 0.5 percent. The energy index, in contrast, declined 3.6 percent in May as the major energy component indexes fell.

The index for all items less food and energy rose 0.4 percent in May, as it did in April and March. Indexes which increased in May include shelter, used cars and trucks, motor vehicle insurance, apparel, and personal care. The index for household furnishings and operations and the index for airline fares were among those that decreased over the month.

The all items index increased 4.0 percent for the 12 months ending May; this was the smallest 12-month increase since the period ending March 2021. The all items less food and energy index rose 5.3 percent over the last 12 months. The energy index decreased 11.7 percent for the 12 months ending May, and the food index increased 6.7 percent over the last year.”

Then two days later, the Labor Department delivered more good news when it reported that the Producer Price Index dropped 0.3% in May.

Consumer Sentiment Jumps

“Consumer sentiment lifted 8% in June, reaching its highest level in four months, reflecting greater optimism as inflation eased and policymakers resolved the debt ceiling crisis. The outlook over the economy surged 28% over the short run and 14% over the long run. Sentiment is now 28% above the historic low from a year ago and may be resuming its upward trajectory since then. As it stands, though, sentiment remains low by historical standards as income expectations softened. A majority of consumers still expect difficult times in the economy over the next year.

Year-ahead inflation expectations receded for the second consecutive month, falling to 3.3% in June from 4.2% in May. The current reading is the lowest since March 2021. In contrast, long-run inflation expectations were little changed from May at 3.0%, again staying within the narrow 2.9-3.1% range for 22 of the last 23 months. Long-run inflation expectations remained elevated relative to the 2.2-2.6% range seen in the two years pre-pandemic.”

Global Investor Confidence Index Up Again

State Street Global Markets released the results of the State Street Investor Confidence Index for June 2023 and announced the following:

“The Global Investor Confidence Index increased to 95.8, up 6.1 points from May’s revised reading of 89.7. The increase in Investor confidence was led by a 4.9 point rise in North American ICI to 90.0 as well as a 5.0 point rise in European ICI to 104.9. Asian ICI, meanwhile, dropped 4.3 points to 96.7”

Global Investor Confidence Index

“Investor confidence was once again stronger in June, with the Global ICI improving for the 6th consecutive month, a streak that has only been replicated once (in 2009) in the 25 years since the creation of the index. While confidence has rallied smartly since the start of the year, it remains below neutral, signaling a continued defensiveness towards overall risk allocations. The North America ICI reading continued to improve as the resolution of the debt ceiling debate removed a significant market risk from the radar. The Europe ICI was also stronger on the month, returning to risk seeking territory as it records the highest reading amongst the regions we track. Finally, Asia investor confidence deteriorated back below neutral as China continues to experience a bumpy post Covid recovery.”

Small Businesses Feeling Optimistic

The National Federation of Independent Businesses reported that “the NFIB Small Business Optimism Index increased 0.4 points in May to 89.4, which is the 17th consecutive month below the 49-year average of 98. The last time the Index was at or above the average was in December 2021. Small business owners expecting better business conditions over the next six months declined one point from April to a net negative 50%. Twenty-five percent of owners reported that inflation was their single most important problem in operating their business, up two points from last month and followed by labor quality at 24%. Key findings include:

  • Forty-four percent of owners reported job openings that were hard to fill, down one point from April and remaining historically very high.

  • The net percent of owners raising average selling prices decreased one point to a net 32% (seasonally adjusted), still an inflationary level but trending down.

  • The net percent of owners who expect real sales to be higher deteriorated two points from April to a net negative 21%.”

Job Openings Still Hard to Fill

Further, as reported in the NFIB’s monthly jobs report:

  • Owners’ plans to fill open positions remain elevated, with a seasonally adjusted net 19% planning to create new jobs in the next three months.

  • Overall, 63% of owners reported hiring or trying to hire in May, up three points from April.

  • Of those hiring or trying to hire, 89% of owners reported few or no qualified applicants for their open positions.

In addition:

  • A net 41% of owners reported raising compensation, up one point from April.

  • A net 22% plan to raise compensation in the next three months, up one point.

  • Ten percent of owners cited labor costs as their top business problem.

  • 24% said that labor quality was their top business problem.

Leading Indicators Decline Again

The Conference Board announced that its Leading Economic Index (LEI) for the U.S. declined by 0.7% in May 2023 to 106.7 (2016=100), following a decline of 0.6% in April. The LEI is down 4.3% over the sixmonth period between November 2022 and May 2023 – a steeper rate of decline than its 3.8% contraction over the previous six months from May to November 2022.

Directly from the release: “the US LEI continued to fall in May as a result of deterioration in the gauges of consumer expectations for business conditions, ISM New Orders Index, a negative yield spread, and worsening credit conditions. The US Leading Index has declined in each of the last fourteen months and continues to point to weaker economic activity ahead. Rising interest rates paired with persistent inflation will continue to further dampen economic activity.

While we revised our Q2 GDP forecast from negative to slight growth, we project that the US economy will contract over the Q3 2023 to Q1 2024 period. The recession likely will be due to continued tightness in monetary policy and lower government spending.”

Further, the Conference Board Coincident Economic Index (CEI) for the U.S. increased by 0.2% in May 2023 to 110.2 (2016=100), after rising by 0.3% in April. The CEI is now up 0.8% over the six-month period between November 2022 and May 2023— down slightly from the 0.9% growth it recorded over the previous six months. The CEI’s component indicators—payroll employment, personal income less transfer payments, manufacturing trade and sales, and industrial production—are included among the data used to determine recessions in the US. While recent data for industrial production have contributed negatively to coincident index, sales, employment, and income growth remained positive.

Finally, the Conference Board Lagging Economic Index (LAG) for the U.S. increased by 0.1% in May 2023 to 118.4 (2016 = 100), reversing a decline of 0.1% in April. The LAG is up 0.6% over the six-month period from November 2022 to April 2023, much slower than its growth rate of 3.3% over the previous six months.

The annual growth rate of the US LEI remained negative, continuing to signal weakening growth prospects

Negative contributions to the LEI were widespread among both financial and non-financial components

Source: The Conference Board

*Inverted series: a negative change in this component makes a positive contribution

**Statistical imputation

LEI change is not equal sum of its contributions due to application of trend adjustment factor

The US LEI continues to signal a recession within the next 12 months

Housing Showing Signs of Momentum

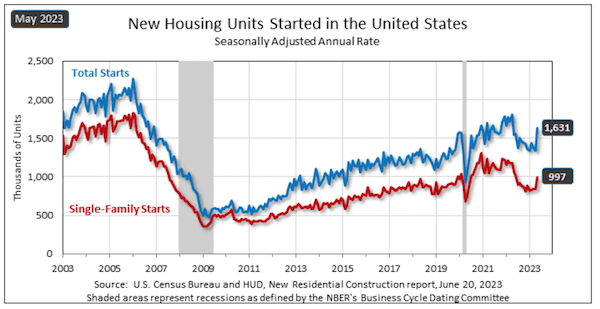
The U.S. Census Bureau and the U.S. Department of Housing and Urban Development jointly announced the following new residential construction statistics for May 2023:

Building Permits

  • Privately‐owned housing units authorized by building permits in May were at a seasonally adjusted annual rate of 1,491,000.

  • This is 5.2% above the revised April rate of 1,417,000.

  • This is 12.7% below the May 2022 rate of 1,708,000.

  • Single‐family authorizations in May were at a rate of 897,000.

  • This is 4.8% above the revised April figure of 856,000.

  • Authorizations of units in buildings with five units or more were at a rate of 542,000 in May.

Housing Starts

  • Privately‐owned housing starts in May were at a seasonally adjusted annual rate of 1,631,000.

  • This is 21.7% above the revised April estimate of 1,340,000.

  • This is 5.7% above the May 2022 rate of 1,543,000.

  • Single‐family housing starts in May were at a rate of 997,000

  • This is 18.5% above the revised April figure of 841,000.

  • The May rate for units in buildings with five units or more was 624,000.

Housing Completions

  • Privately‐owned housing completions in May were at a seasonally adjusted annual rate of 1,518,000.

  • This is 9.5% above the revised April estimate of 1,386,000.

  • This is 5.0% above the May 2022 rate of 1,446,000.

  • Single‐family housing completions in May were at a rate of 1,009,000; this is 3.9% above the revised April rate of 971,000.

  • The May rate for units in buildings with five units or more was 493,000.

Manufactured Durable Goods Up in May

The U.S. Census Bureau announced the May advance report on durable goods manufacturers’ shipments, inventories and orders:

New Orders

New orders for manufactured durable goods in May, up three consecutive months, increased $4.9 billion or 1.7% to $288.2 billion.

  • This followed a 1.2% April increase.

  • Excluding transportation, new orders increased 0.6%.

  • Excluding defense, new orders increased 3.0%.

  • Transportation equipment, also up three consecutive months, led the increase, $3.9 billion or 3.9% to $102.6 billion.

New Orders Over the Past 12 Months

Shipments

Shipments of manufactured durable goods in May, up two of the last three months, increased $4.8 billion or 1.7% to $282.7 billion. This followed a 0.6% April decrease. Transportation equipment, also up two of the last three months, led the increase, $4.0 billion or 4.6% to $91.8 billion.

Unfilled Orders

Unfilled orders for manufactured durable goods in May, up five of the last six months, increased $10.6 billion or 0.8% to $1,302.0 billion. This followed a 0.8% April increase. Transportation equipment, also up five of the last six months, drove the increase, $10.8 billion or 1.4% to $803.9 billion.

Inventories

Inventories of manufactured durable goods in May, up five of the last six months, increased $1.2 billion or 0.2% to $522.9 billion. This followed a 1.0% April increase. Machinery, up thirty-one consecutive months, led the increase, $0.5 billion or 0.5% to $94.4 billion.

Capital Goods

Non-defense new orders for capital goods in May increased $5.7 billion or 6.7% to $91.0 billion. Shipments increased $2.7 billion or 3.4% to $82.9 billion. Unfilled orders increased $8.1 billion or 1.1% to $748.7 billion. Inventories increased $0.1 billion or 0.1% to $225.5 billion. Defense new orders for capital goods in May decreased $2.7 billion or 14.7% to $15.9 billion. Shipments decreased $0.2 billion or 1.2% to $13.2 billion. Unfilled orders increased $2.7 billion or 1.3% to $213.6 billion. Inventories increased $0.1 billion or 0.2% to $24.2 billion.
Ivan Havrylyan
6 Reasons to Think Outside the Box with Outside the Box Financial Planning

Whether you live in the Chicago area or not, chances are you stumbled across this article while searching for a Chicago financial planner or virtual financial advisor. The good news? You’re in the right place! 

And because you’re here, I assume you have a few pressing issues in your life that have led you to believe your financial situation needs a bit of help.

Plan for your retirement to secure your financial future

Perhaps you and your wife are three years from retirement, the accounts look good, and you’ve invested and saved, but what’s next? How do you make your hard-earned retirement last the next 10, 20, or even 30 years? 

Or maybe, in a tragic turn of events, you lost your spouse much sooner than you thought possible, and you’re completely lost. 

You need insight, empathy, and advice to streamline your financial future. You and your spouse's fortune needs to be properly managed so your children and grandchildren can reap the benefits of your dear ones' long and hard years in the workforce.

At Outside the Box Financial Planning, I invite you to pour your favorite drink, enjoy the summer breeze, and be assured my experience in the financial industry will help you through any financial adventure. Here are 6 reasons why my services and expertise can meet your financial planning needs in the richest season of your life.

Planning for your future can be a breeze with Outside the Box Financial Planning

1. With Outside the Box You Get More…

  • More experience.

  • More continuing education. 

  • More knowledge of the financial industry.

You know there is so much more to building wealth than simply making money. Where will your hard-earned money grow and compound the best? What accounts are needed in the current market to ensure you don’t lose your retirement? 

Continuing education is just one of the many ways to stay up to date with the ever-changing financial world. I strive to improve my understanding of what makes a healthy financial portfolio and how to navigate the financial waters. After educating myself, I pass on my knowledge to you in easy-to-understand language so you can thrive and make sound decisions for your life and family.

And when retirement comes, you can count on me to supply you with Social Security claiming strategies and Medicare options. This gives you a chance at a retirement free of stress and full of abundance. 

With over 10 years of experience in the financial industry, I can identify the trends and changes to better anticipate the rollercoaster that accompanies financial growth.

Think outside the box for your financial planning

2. I Am A Fee-Only Financial Planner

What Does Fee-Only Mean? 

There are two models of compensation for financial advisors; commissions-based and fees based. A commissions-based advisor is very similar to a car salesman who earns his income based on the price of the car. The more he sells, the more he earns. This type of model makes it difficult for the client to receive completely unbiased advice. 

Put simply, the commission-based advisor is more prone to bias and doesn’t always work in the client's best interest. His protocol may encourage him to sell products to the client that aren't particularly necessary, causing the client's money to be spent needlessly. 

As a fee-only financial planner, I only charge one fee based on the package we choose that best fits your needs. 

Why Should You Choose a Fee-Only Financial Planner?

When you choose to work with someone, you need to know they have your best interest, right? This is especially true when your finances are involved. You need to know that any advice given is sound and honest with no hint of upselling on a product. 

You can relax knowing that when you work with me, I will always advise based on what is in your best interest, not mine. 

Once we choose the best course for your needs, I am available for advice at any time (within business hours, of course), unlike a commission-based advisor who is restricted to the limits of the services chosen. 

Get unbiased advise with the fee-only services offered at Outside the Box Financial Planning

3. I Am A Certified Financial Planner (CFP)

As a Certified Financial Planner (CFP), I have undergone rigorous training to ensure my unbiased and well-educated advice is the best in the market. 

CFP is a formal title given by the Certified Financial Planner Board of Standards, Inc, which requires thorough training beyond that of a generic financial advisor. The training includes: 

  • Numerous standardized tests

  • Commitment to a code of ethics

  • Formal education

All of this ensures you are getting the best advice for your financial situation possible. 

And most importantly for the client, CFPs are fiduciaries, which means they swear to always help make the best financial decisions for their clients, not in the interest of filling the advisor’s checking account. 

You can trust that every service provided keeps your success at the forefront of every decision. 

4. I Am An Expert In Retirement Management 

Retirement should be filled with adventure and joy. You have worked tirelessly to earn your wealth and now you get to enjoy it.

As I mentioned above, I have a vast array of knowledge surrounding retirement topics. I have specific programs that will help you focus on retirement planning and lifetime tax minimization. There are numerous retirement options and I understand how overwhelming it can be to make the “right” decision. 

My consultations will give you the peace of mind you deserve after years of working hard to build your nest egg. 

With Outside the Box Financial Planning, get peace of mind knowing the nest egg you've been building will sustain you in your retirement

5. I Am A Virtual Financial Advisor

You want to travel the world and explore places you’ve always dreamed of. Or maybe you want to hop in an RV and travel America to visit your 12 grandchildren. Either way, your financial well-being doesn’t have to stay within the confines of Chicago. 

So if you're on the beach of Greece and you get a notification that your stocks plummeted, give me a call, and I’ll encourage you and remind you of our strategies. Additionally, if you decide to retire on the sunny beaches of Florida, you won’t lose me. You’ll continue to receive the consistent support you’ve come to rely on. 

But if you are in Chicago and want to chat over coffee on Michigan Ave while watching the bustle of tourists, I’m eager to chat about wealth management and whether Gino's East or Giordano’s is the king of deep dish.  

Our relationship also doesn’t have to begin with you being in Chicago. If you’re on the west or east coast, or anywhere in between, I’d be happy to help you on your time, completely virtually. 

6. Outside the Box Is An Intimate Financial Firm 

You’ll never have to worry about waiting on hold for hours on end only to be met by an automated machine. My firm is small and will stay small so that I can meet all the needs of my clients and “do life” with them. My ambition has never been to grow for growth's sake, rather, I want to serve a small number of clients to the best of my ability. 

Our relationship will grow and mature as your finances do. You will always receive custom advice that is transparent and tailored to your needs alone. You’ll also feel like you have a friend in the business. I make complicated news and unfamiliar terms easy to understand and relevant to your situation. 

Outside the Box is committed to keeping a client load that allows for personal relationships and a high level of expertise to support your complex financial needs.

At Outside the Box Financial Planning, you get my undivided attention and can rest assured that I have your best interest in mind

Think Outside the Box and Receive Peace of Mind

Financial planning doesn’t have to be overwhelming. At Outside the Box Financial Planning, I understand your wealth has taken years to accumulate and you want it to be managed well. 

I want you to feel at peace while you travel the world, snuggle with your grandchildren, or pursue new hobbies. To see if we can help you better understand your investment options or wealth management, click here to schedule a conversation today. 


Partnering with Outside The Box Financial Planning offers numerous benefits for individuals seeking retirement planning, small business support, wealth management, and beyond.  With their fiduciary duty, comprehensive approach, unbiased advice, transparent fee structure, and ongoing support, OTBFP act as a trusted advisor who prioritizes your best interests. Click here to schedule a complimentary “Fit” meeting to determine if we would make a good mutual fit.

Remember, financial decisions have long-lasting implications, and working with a professional can provide the expertise and guidance necessary to make informed choices that align with your financial aspirations. 

However, if you would like to take a shot at building a financial plan on your own, we offer our financial planning software, RightCapital, free of charge. Click here to get started.

Content in this material is for general information only and is not intended to provide specific advice or recommendations for any individual.

Ivan Havrylyan
Q1 2023 Quarterly Market Commentary

Markets Have Good First Quarter

Global equity markets had a good first quarter – especially the tech names. And interestingly, in the fourth quarter of 2022, global equity markets also had a pretty good quarter – except for the tech names.

When the final Wall Street bell of the quarter rang out, NASDAQ had turned in its best quarterly gain since 2020, and the other three major U.S. equity indices turned in solid results too.

For the first quarter of 2023:

  • The DJIA advanced by 0.5%;

  • The S&P 500 gained 6.9%;

  • NASDAQ jumped 16.8%; and

  • The Russell 2000 added 2.3%.

The themes that drove market performance in the first quarter centered around inflation, the Fed, and the labor market, as recent inflation numbers hinted at a potential decline. In contrast, labor market numbers suggested that the Fed could continue its pace of rate hikes further into the year.

This quarter's other big theme was a new banking crisis – as Silicon Valley Bank and Signature Bank failed – with SVB being the largest bank failure since 2008. That helped push gold close to its record high.

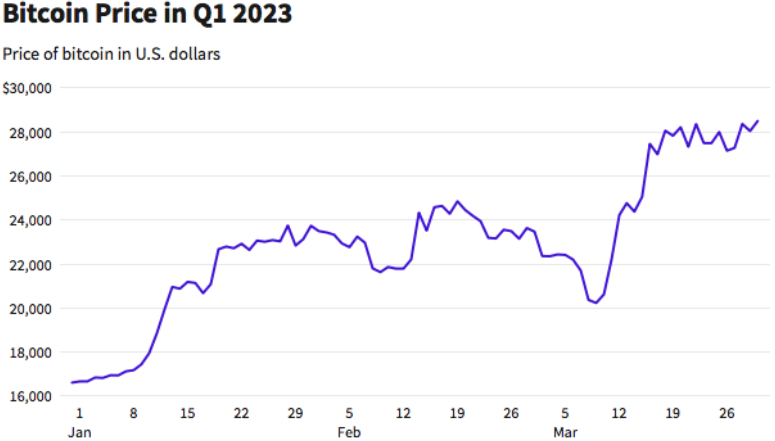
And as a surprise to many, cryptocurrencies extended their recovery from 2022's disaster, with Bitcoin leaping more than 50%.

Further, we saw that:

  • Volatility, as measured by the VIX, trended down this quarter, beginning just north of 21 and ending just shy of 19, although there was a significant spike in mid-March.

  • West Texas Intermediate crude also trended down for the quarter, starting at just over $80/barrel and ending at just over $75, with a low of $67/barrel in mid-March.

Market Performance Around the World

Investors were pleased with the quarterly performance worldwide, as all 36 developed markets tracked by MSCI were positive for the first quarter of 2023 – that’s the second quarter in a row that saw all 36 MSCI developed market indices green. And for the 40 developing markets tracked by MSCI, only 28 of those were positive.

1q2023 msci developing markets

Source: MSCI. Past performance cannot guarantee future results

Sector Performance Rotated in Q12023

The overall sector performance for the first quarter of 2023 was ok, as 4 of the 11 sectors lost ground. But of the seven sectors that gained ground, the gains were significant. Compare that to the overall trend for the fourth quarter, which was good, as 9 of the 11 sectors advanced, with six advancing by double-digits, and going back to the third quarter of last year, which was ugly, as 10 of the 11 S&P 500 sectors dropped with only Consumer Discretionary staying positive.

Finally, as happened in each quarter last year, the performance leaders and laggards rotated throughout the quarter, and the ranges were substantial.

Here are the sector returns for the first quarter of 2023 and the fourth quarter of 2022:

q1 2023 vs q4 2022 sector returns

Source: FMR

Reviewing the sector returns for just the first quarter of 2023, we saw that:

  • Only 7 of the 11 sectors were painted green, although the Information Technology and Consumer Discretionary sectors made giant leaps;

  • The defensive sectors (think Utilities and Health Care) struggled during the quarter

  • Financials – not surprisingly – was the worst performer, driven down by two significant bank failures; and

  • The difference between the best (+21%) performing and worst (-6%) performing sectors in the first quarter was massive.

Two Interesting Rallies This Quarter

bitcoin price in q1 2023
gold spot price in q1 2023

Volatility in the Treasury Market

10 year treasury yields in q1 2023

The Fed Raises Rates Again

One of the most talked about events this quarter was the Federal Reserve’s policy meetings, and as expected, the Fed raised official short-term rates by 25 basis points in late March. Further, the “dot plot” pointed to hopes that the Fed might stop raising rates after one final one in May. Most interesting is that the fed funds futures markets ended the week pricing in a 98.2% chance that rates would end the year lower – with a whopping 95% chance that cuts would start this summer.

market expects fed to cut rates

Source: CME Fed Watch

For perspective, it was almost exactly one year ago, on March 16, 2022, that the Federal Open Market Committee enacted the first of what would become nine consecutive interest rate increases.

historical fed funds rate

GDP Up 2.6% in 4th Quarter

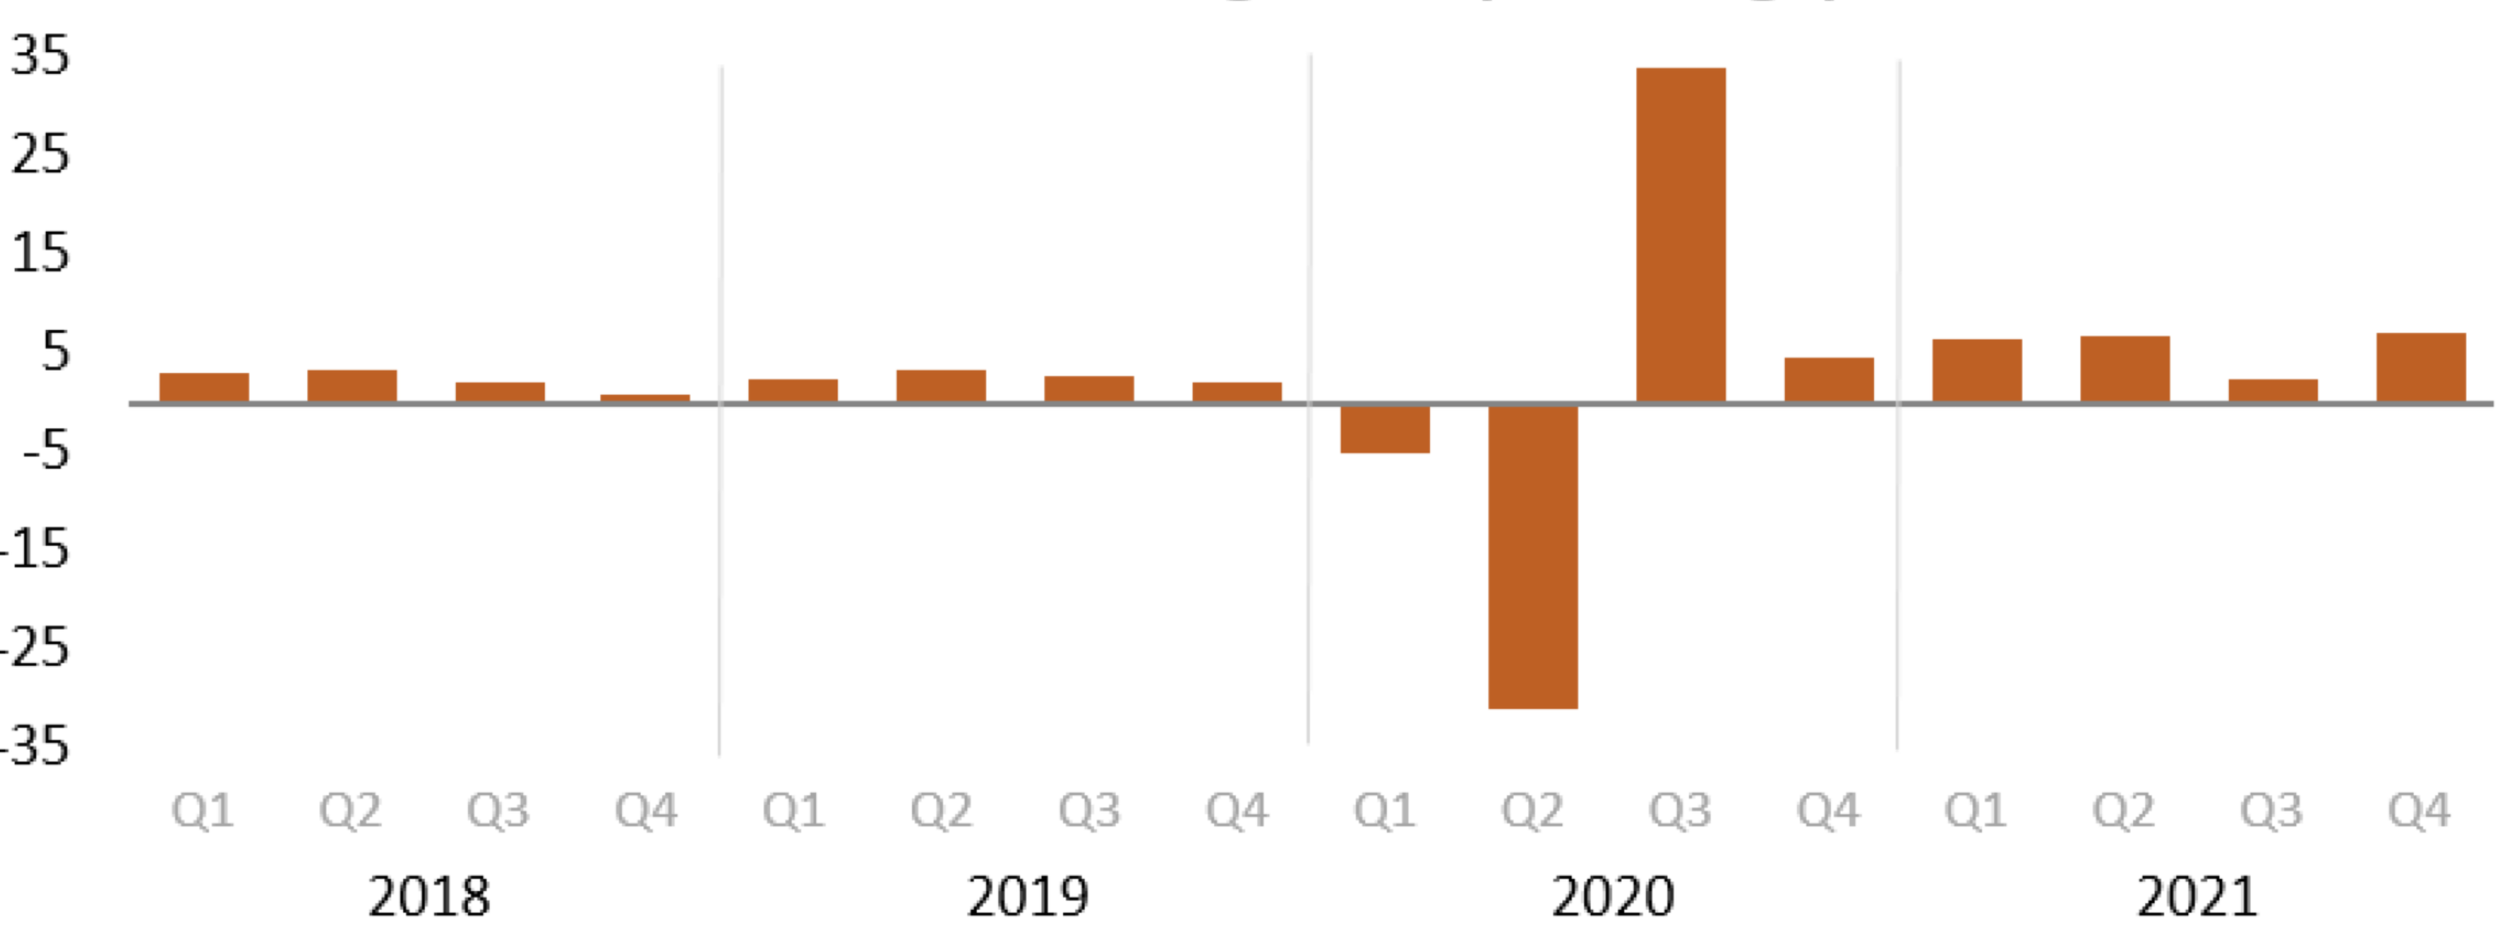
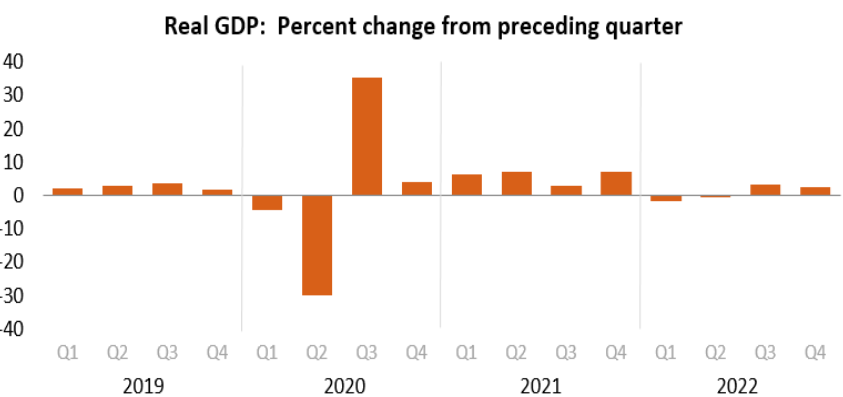
As the quarter ended, the Bureau of Economic Analysis reported that the real gross domestic product increased at an annual rate of 2.6% in the fourth quarter of 2022. In the third quarter, real GDP increased by 3.2%.

This is the “third” GDP estimate released, and it is based on more complete source data than was available for the "second" estimate issued last month. In the second estimate, the increase in real GDP was 2.7%. The revision primarily reflected downward revisions to exports and consumer spending. Imports, a subtraction in the calculation of GDP, were revised down.

real gdp percent change from preceding quarter

U.S. Bureau of Economic Analysis. Seasonally adjusted annual rates.

“The increase in real GDP primarily reflected increases in private inventory investment, consumer spending, nonresidential fixed investment, federal government spending, and state and local government spending that were partly offset by decreases in residential fixed investment and exports. Imports decreased.

Consumer Sentiment Drops

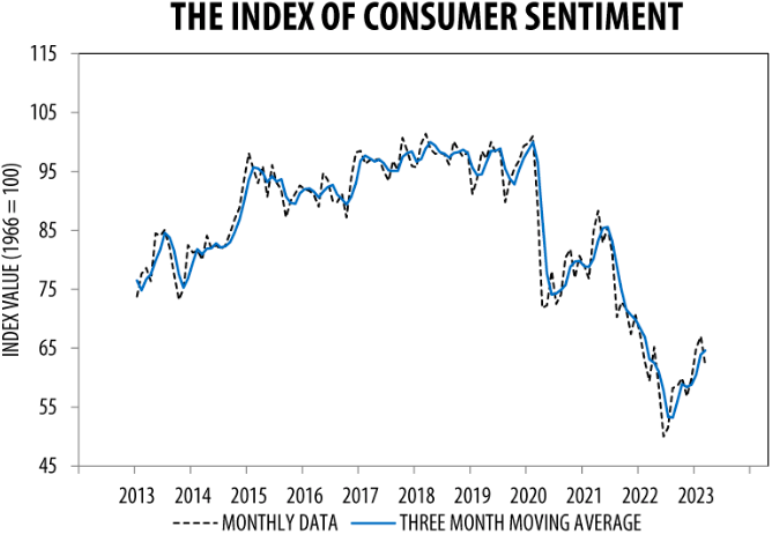
“Consumer sentiment fell for the first time in four months, dropping about 8% below February but remaining 4% above a year ago. This month’s turmoil in the banking sector had limited impact on consumer sentiment, which was already exhibiting downward momentum prior to the collapse of Silicon Valley Bank. Overall, our data revealed multiple signs that consumers increasingly expect a recession ahead. While sentiment fell across all demographic groups, the declines were sharpest for lower-income, less- educated, and younger consumers, as well as consumers with the top tercile of stock holdings. All five index components declined this month, led by a notably sharp weakening in one-year business conditions.

Year-ahead inflation expectations receded from 4.1% in February to 3.6%, the lowest reading since April 2021, but remained well above the 2.3-3.0% range seen in the two years before the pandemic. Long-run inflation expectations came in at 2.9% for the fourth consecutive month and stayed within the narrow 2.9- 3.1% range for 19 of the last 20 months.

the index of consumer sentiment

But Consumer Confidence is Up

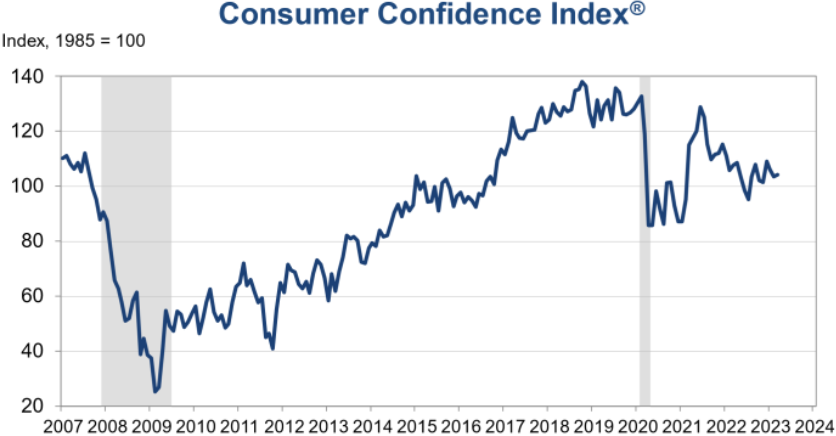
The Conference Board Consumer Confidence Index increased slightly in March to 104.2 (1985=100), up from 103.4 in February.

Further:

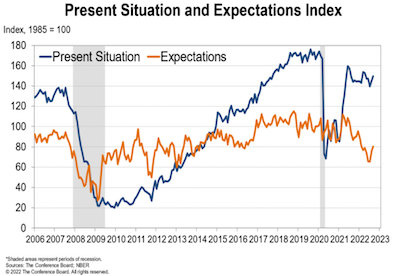
  • The Present Situation Index—based on consumers’ assessment of current business and labor market conditions—decreased to 151.1 (1985=100) from 153.0 last month.

  • The Expectations Index—based on consumers’ short-term outlook for income, business, and labor market conditions— ticked up to 73.0 (1985=100) from 70.4 in February (a slight upward revision).

  • However, for 12 of the last 13 months—since February 2022—the Expectations Index has been below 80, which often signals a recession within the next year. “Driven by an uptick in expectations, consumer confidence improved somewhat in March but remains below the average level seen in 2022 (104.5).

“The gain reflects an improved outlook for consumers under 55 years of age and for households earning $50,000 and over. While consumers feel a bit more confident about what’s ahead, they are slightly less optimistic about the current landscape. The share of consumers saying jobs are ‘plentiful’ fell, while the share of those saying jobs are ‘not so plentiful’ rose.

The latest results also reveal that their inflation expectations over the next 12 months remain elevated – at 6.3 percent. Overall purchasing plans for appliances continued to soften while automobile purchases saw a slight increase.”

consumer confidence index

Sources: The Conference Board; NBER

CPI Records Smaller Increase, But Food Index is Up 9.5% Over the Last Year

The U.S. Bureau of Labor Statistics reported that the Consumer Price Index for All Urban Consumers rose 0.4% in February after increasing 0.5% in January. Over the last 12 months, the all-items index increased by 6.0% before seasonal adjustment.

12 month percentage change CPI

Source: U.S. Bureau of Labor Statistics.

Specifically:

  • The index for shelter was the largest contributor to the monthly all-items increase, accounting for over 70% of the increase, with the indexes for food, recreation, and household furnishings and operations also contributing.

  • The food index increased 0.4% over the month, with the food at home index rising 0.3%.

  • The energy index decreased 0.6% over the month as the natural gas and fuel oil indexes declined.

  • Categories that increased in February include shelter, recreation, household furnishings and operations, and airline fares.

  • The index for used cars and trucks and the index for medical care were among those that decreased over the month.

Inflation Over the Past 12-Months

The all-items index increased 6.0% for the 12 months ending February; this was the smallest 12-month increase since the period ending September 2021.

  • All items less food and energy index rose 5.5% over the last 12 months, its smallest 12-month increase since December 2021.

  • The energy index increased 5.2% for the 12 months ending February.

  • The food index increased by 9.5% over the last year.

Food Index

  • The food index increased 0.4% in February, and the food at home index rose 0.3% over the month. Five major grocery store food group indexes increased over the month. The index for nonalcoholic beverages increased by 1.0% in February, after a 0.4% increase the previous month.

  • The indexes for other food at home and for cereals and bakery products each rose 0.3% over the month. The index for fruits and vegetables increased by 0.2% in February, and the index for dairy and related products rose by 0.1%.

  • In contrast, the meats, poultry, fish, and eggs index fell 0.1 percent over the month, the first decrease in that index since December 2021. The index for eggs fell 6.7% in February following sharp increases in recent months.

Existing Home Sales Jump in February

The National Association of Realtors reported that “existing-home sales reversed a 12-month slide in February, registering the largest monthly percentage increase since July 2020. Month-over-month sales rose in all four major U.S. regions. All regions posted year-over-year declines.

  • Total existing-home sales completed transactions that include single-family homes, townhomes, condominiums, and co-ops – vaulted 14.5% from January to a seasonally adjusted annual rate of 4.58 million in February.

  • Year-over-year, sales fell 22.6% (down from 5.92 million in February 2022).

  • The total housing inventory registered at the end of February was 980,000 units, identical to January and up 15.3% from one year ago (850,000).

  • Unsold inventory sits at a 2.6-month supply at the current sales pace, down 10.3% from January but up from 1.7 months in February 2022.”

existing home sales

Prices Slide After 131 Months of Gains

  • “The median existing-home price for all housing types in January was $363,000, a decline of 0.2% from February 2022 ($363,700), as prices climbed in the Midwest and South yet waned in the Northeast and West.

  • This ends a streak of 131 consecutive months of year-over-year increases, the longest on record.

  • Properties typically remained on the market for 34 days in February, up from 33 days in January and 18 days in February 2022.

  • Fifty-seven percent of homes sold in February were on the market for less than a month.

  • First-time buyers were responsible for 27% of sales in February, down from 31% in January and 29% in February 2022.

  • All-cash sales accounted for 28% of transactions in February, down from 29% in January but up from 25% in February 2022.

  • Distressed sales – foreclosures and short sales – represented 2% of sales in February, nearly identical to last month and one year ago.

Regional Breakdown

  • Existing-home sales in the Northeast improved by 4.0%, down 25.7% from February 2022. The median price in the Northeast was $366,100, down 4.5% from the previous year.

  • In the Midwest, existing-home sales grew 13.5%, declining 18.7% from one year ago. The median price in the Midwest was $261,200, up 5.0% from February 2022.

  • Existing-home sales in the South rebounded 15.9% in February, a 21.3% decrease from the prior year. The median price in the South was $342,000, an increase of 2.7% from one year ago.

  • In the West, existing-home sales rocketed 19.4% in February, down 28.3% from the previous year. The median price in the West was $541,100, down 5.6% from February 2022.”

Durable Goods Orders Drop Again

The U.S. Census Bureau announced the February advance report on durable goods manufacturers’ shipments, inventories, and orders:

Source: U.S. Census Bureau, Manufacturers’ Shipments, Inventories, and Orders, March 24, 2023.

New Orders

  • New orders for manufactured durable goods in February, down three of the last four months, decreased $2.6 billion or 1.0% to $268.4 billion.

  • This followed a 5.0% January decrease.

  • Excluding transportation, new orders were virtually unchanged.

  • Excluding defense, new orders decreased by 0.5%.

  • Also down three of the last four months, transportation equipment drove the decrease, $2.6 billion or 2.8% to $89.4 billion.

Shipments

  • In February, the shipment of manufactured durable goods in two consecutive months decreased by $1.5 billion or 0.6% to $274.8 billion.

  • This followed a 0.4% January decrease.

  • Also down two consecutive months, transportation equipment led the decrease, $1.3 billion or 1.4% to $90.1 billion.

Unfilled Orders

  • Unfilled orders for manufactured durable goods in February, down two consecutive months, decreased $1.2 billion or 0.1% to $1,155.4 billion.

  • This followed a virtually unchanged January decrease.

  • Transportation equipment, down following twenty-one consecutive monthly increases, led the decrease, $0.7 billion or 0.1% to $683.8 billion.

Inventories

  • Inventories of manufactured durable goods in February, up twenty-four of the last twenty- five months, increased $0.9 billion or 0.2% to $493.6 billion.

  • This followed a 0.2% January decrease.

  • Up three of the last four months, transportation equipment led the increase, $0.6 billion or 0.4% to $158.8 billion.

Capital Goods

  • Nondefense new orders for capital goods in February decreased $1.0 billion or 1.2% to $82.0 billion.

  • Shipments decreased by $0.5 billion or 0.6% to $83.2 billion.
  • Unfilled orders decreased by $1.2 billion or 0.2% to $662.6 billion.

  • Inventories increased by $0.5 billion or 0.2% to $218.8 billion.

  • Defense new orders for capital goods in February decreased $1.2 billion or 7.4% to $14.5 billion.

  • Shipments decreased by $0.2 billion or 1.6% to $14.6 billion.
  • Unfilled orders decreased by $0.2 billion or 0.1% to $188.9 billion.
  • Inventories increased by $0.1 billion or 0.3% to $23.3 billion.
Sources: dol.gov; nar.realtor; umich.edu; census.gov; bea.gov; fidelity.com; msci.com; nasdaq.com; wsj.com; morningstar.com


Partnering with Outside The Box Financial Planning offers numerous benefits for individuals seeking retirement planning, small business support, wealth management, and beyond.  With their fiduciary duty, comprehensive approach, unbiased advice, transparent fee structure, and ongoing support, OTBFP act as a trusted advisor who prioritizes your best interests. Click here to schedule a complimentary “Fit” meeting to determine if we would make a good mutual fit.

Remember, financial decisions have long-lasting implications, and working with a professional can provide the expertise and guidance necessary to make informed choices that align with your financial aspirations. 

However, if you would like to take a shot at building a financial plan on your own, we offer our financial planning software, RightCapital, free of charge. Click here to get started.