

Markets Have Good First Quarter
Global equity markets had a good first quarter – especially the tech names. And interestingly, in the fourth quarter of 2022, global equity markets also had a pretty good quarter – except for the tech names.
When the final Wall Street bell of the quarter rang out, NASDAQ had turned in its best quarterly gain since 2020, and the other three major U.S. equity indices turned in solid results too.
For the first quarter of 2023:
The DJIA advanced by 0.5%;
The S&P 500 gained 6.9%;
NASDAQ jumped 16.8%; and
The Russell 2000 added 2.3%.
The themes that drove market performance in the first quarter centered around inflation, the Fed, and the labor market, as recent inflation numbers hinted at a potential decline. In contrast, labor market numbers suggested that the Fed could continue its pace of rate hikes further into the year.
This quarter's other big theme was a new banking crisis – as Silicon Valley Bank and Signature Bank failed – with SVB being the largest bank failure since 2008. That helped push gold close to its record high.
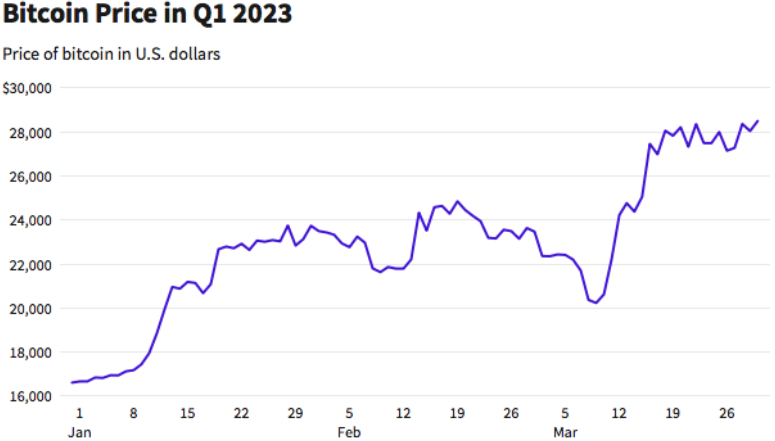
And as a surprise to many, cryptocurrencies extended their recovery from 2022's disaster, with Bitcoin leaping more than 50%.
Further, we saw that:
Volatility, as measured by the VIX, trended down this quarter, beginning just north of 21 and ending just shy of 19, although there was a significant spike in mid-March.
West Texas Intermediate crude also trended down for the quarter, starting at just over $80/barrel and ending at just over $75, with a low of $67/barrel in mid-March.
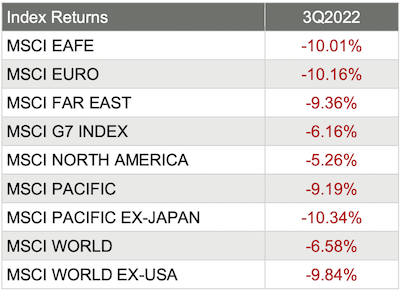
Market Performance Around the World
Investors were pleased with the quarterly performance worldwide, as all 36 developed markets tracked by MSCI were positive for the first quarter of 2023 – that’s the second quarter in a row that saw all 36 MSCI developed market indices green. And for the 40 developing markets tracked by MSCI, only 28 of those were positive.
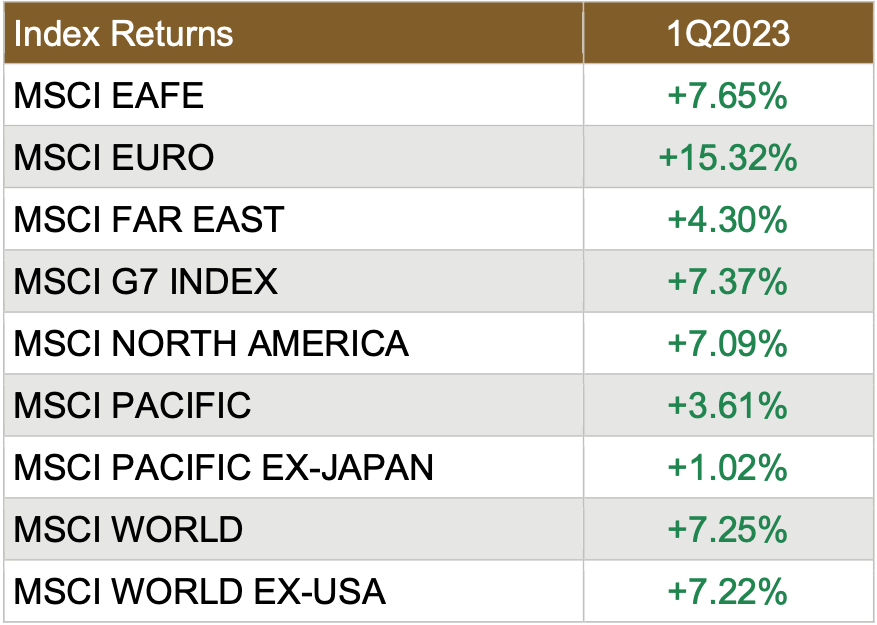
Source: MSCI. Past performance cannot guarantee future results
Sector Performance Rotated in Q12023
The overall sector performance for the first quarter of 2023 was ok, as 4 of the 11 sectors lost ground. But of the seven sectors that gained ground, the gains were significant. Compare that to the overall trend for the fourth quarter, which was good, as 9 of the 11 sectors advanced, with six advancing by double-digits, and going back to the third quarter of last year, which was ugly, as 10 of the 11 S&P 500 sectors dropped with only Consumer Discretionary staying positive.
Finally, as happened in each quarter last year, the performance leaders and laggards rotated throughout the quarter, and the ranges were substantial.
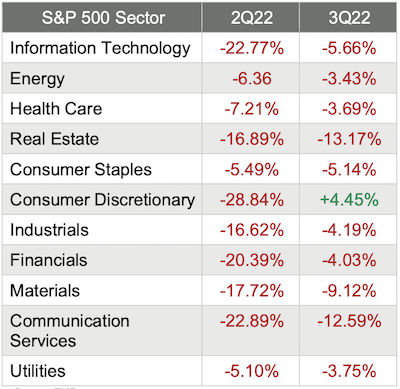
Here are the sector returns for the first quarter of 2023 and the fourth quarter of 2022:
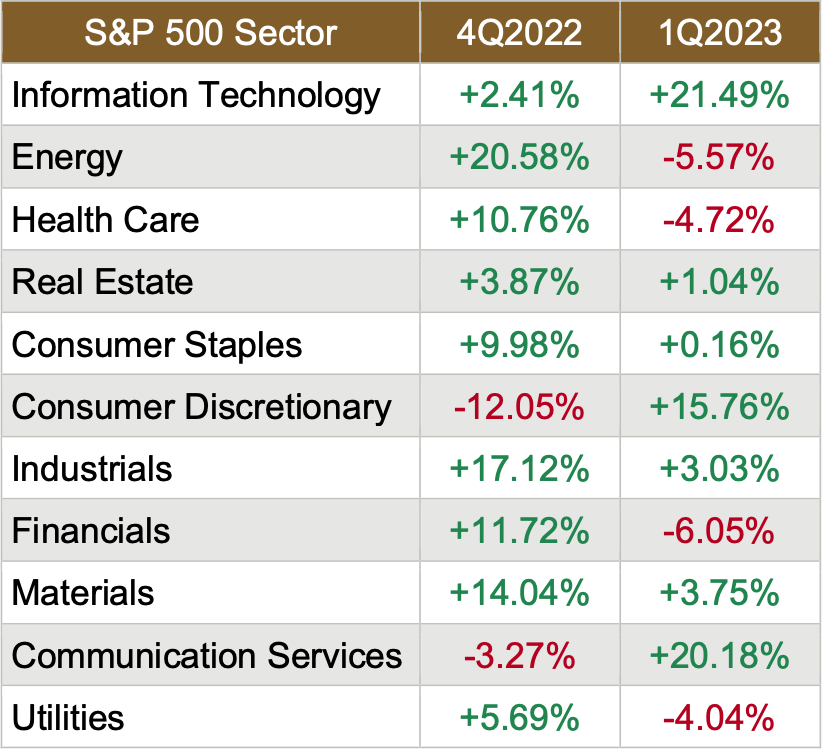
Source: FMR
Reviewing the sector returns for just the first quarter of 2023, we saw that:
Only 7 of the 11 sectors were painted green, although the Information Technology and Consumer Discretionary sectors made giant leaps;
The defensive sectors (think Utilities and Health Care) struggled during the quarter
Financials – not surprisingly – was the worst performer, driven down by two significant bank failures; and
The difference between the best (+21%) performing and worst (-6%) performing sectors in the first quarter was massive.
Two Interesting Rallies This Quarter

Volatility in the Treasury Market

The Fed Raises Rates Again
One of the most talked about events this quarter was the Federal Reserve’s policy meetings, and as expected, the Fed raised official short-term rates by 25 basis points in late March. Further, the “dot plot” pointed to hopes that the Fed might stop raising rates after one final one in May. Most interesting is that the fed funds futures markets ended the week pricing in a 98.2% chance that rates would end the year lower – with a whopping 95% chance that cuts would start this summer.

Source: CME Fed Watch
For perspective, it was almost exactly one year ago, on March 16, 2022, that the Federal Open Market Committee enacted the first of what would become nine consecutive interest rate increases.

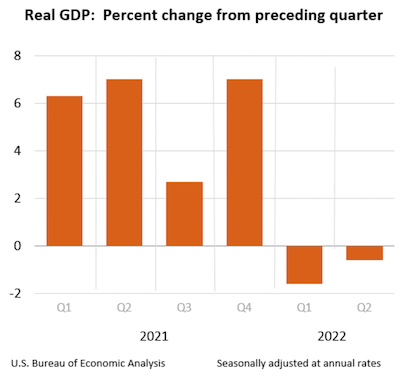
GDP Up 2.6% in 4th Quarter
As the quarter ended, the Bureau of Economic Analysis reported that the real gross domestic product increased at an annual rate of 2.6% in the fourth quarter of 2022. In the third quarter, real GDP increased by 3.2%.
This is the “third” GDP estimate released, and it is based on more complete source data than was available for the "second" estimate issued last month. In the second estimate, the increase in real GDP was 2.7%. The revision primarily reflected downward revisions to exports and consumer spending. Imports, a subtraction in the calculation of GDP, were revised down.
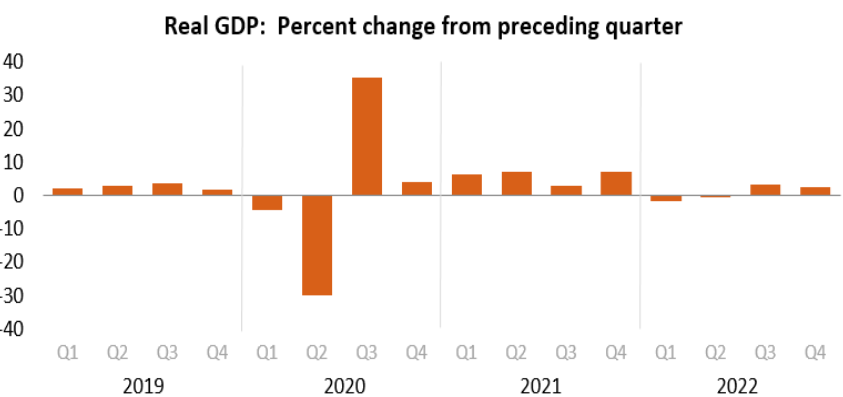
U.S. Bureau of Economic Analysis. Seasonally adjusted annual rates.
“The increase in real GDP primarily reflected increases in private inventory investment, consumer spending, nonresidential fixed investment, federal government spending, and state and local government spending that were partly offset by decreases in residential fixed investment and exports. Imports decreased.
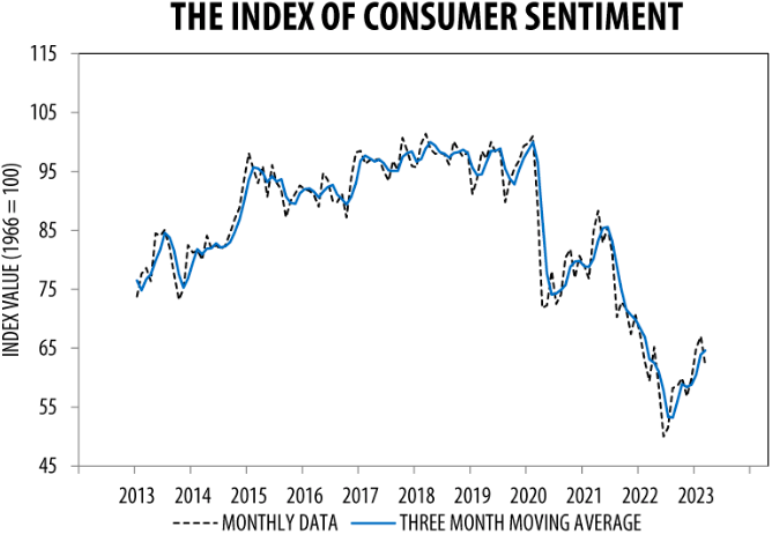
Consumer Sentiment Drops
“Consumer sentiment fell for the first time in four months, dropping about 8% below February but remaining 4% above a year ago. This month’s turmoil in the banking sector had limited impact on consumer sentiment, which was already exhibiting downward momentum prior to the collapse of Silicon Valley Bank. Overall, our data revealed multiple signs that consumers increasingly expect a recession ahead. While sentiment fell across all demographic groups, the declines were sharpest for lower-income, less- educated, and younger consumers, as well as consumers with the top tercile of stock holdings. All five index components declined this month, led by a notably sharp weakening in one-year business conditions.
Year-ahead inflation expectations receded from 4.1% in February to 3.6%, the lowest reading since April 2021, but remained well above the 2.3-3.0% range seen in the two years before the pandemic. Long-run inflation expectations came in at 2.9% for the fourth consecutive month and stayed within the narrow 2.9- 3.1% range for 19 of the last 20 months.
But Consumer Confidence is Up
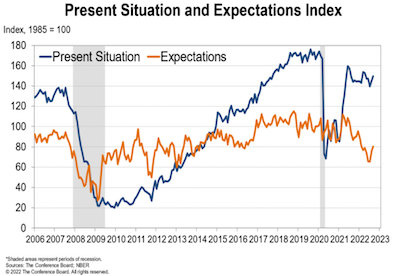
The Conference Board Consumer Confidence Index increased slightly in March to 104.2 (1985=100), up from 103.4 in February.
Further:
The Present Situation Index—based on consumers’ assessment of current business and labor market conditions—decreased to 151.1 (1985=100) from 153.0 last month.
The Expectations Index—based on consumers’ short-term outlook for income, business, and labor market conditions— ticked up to 73.0 (1985=100) from 70.4 in February (a slight upward revision).
However, for 12 of the last 13 months—since February 2022—the Expectations Index has been below 80, which often signals a recession within the next year. “Driven by an uptick in expectations, consumer confidence improved somewhat in March but remains below the average level seen in 2022 (104.5).
“The gain reflects an improved outlook for consumers under 55 years of age and for households earning $50,000 and over. While consumers feel a bit more confident about what’s ahead, they are slightly less optimistic about the current landscape. The share of consumers saying jobs are ‘plentiful’ fell, while the share of those saying jobs are ‘not so plentiful’ rose.
The latest results also reveal that their inflation expectations over the next 12 months remain elevated – at 6.3 percent. Overall purchasing plans for appliances continued to soften while automobile purchases saw a slight increase.”
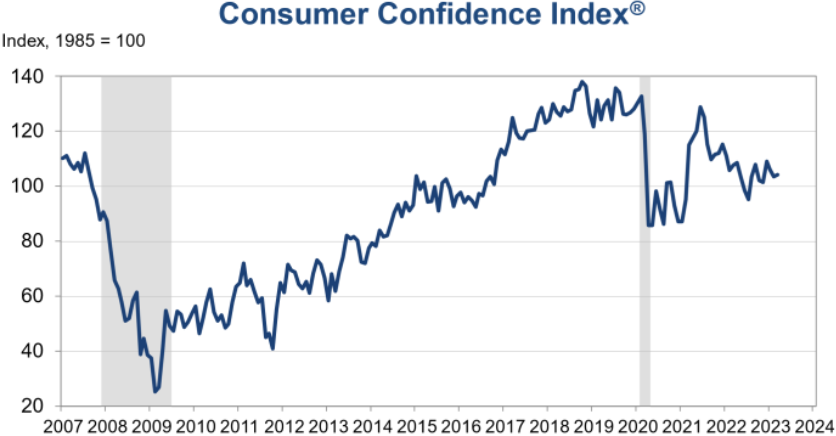
Sources: The Conference Board; NBER
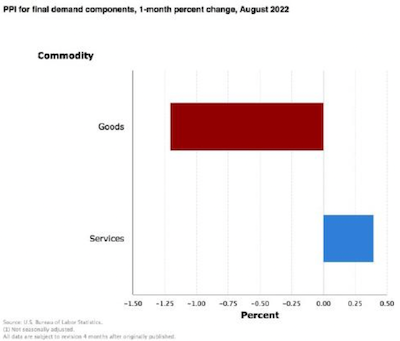
CPI Records Smaller Increase, But Food Index is Up 9.5% Over the Last Year
The U.S. Bureau of Labor Statistics reported that the Consumer Price Index for All Urban Consumers rose 0.4% in February after increasing 0.5% in January. Over the last 12 months, the all-items index increased by 6.0% before seasonal adjustment.

Source: U.S. Bureau of Labor Statistics.
Specifically:
The index for shelter was the largest contributor to the monthly all-items increase, accounting for over 70% of the increase, with the indexes for food, recreation, and household furnishings and operations also contributing.
The food index increased 0.4% over the month, with the food at home index rising 0.3%.
The energy index decreased 0.6% over the month as the natural gas and fuel oil indexes declined.
Categories that increased in February include shelter, recreation, household furnishings and operations, and airline fares.
The index for used cars and trucks and the index for medical care were among those that decreased over the month.
Inflation Over the Past 12-Months
The all-items index increased 6.0% for the 12 months ending February; this was the smallest 12-month increase since the period ending September 2021.
All items less food and energy index rose 5.5% over the last 12 months, its smallest 12-month increase since December 2021.
The energy index increased 5.2% for the 12 months ending February.
The food index increased by 9.5% over the last year.
Food Index
The food index increased 0.4% in February, and the food at home index rose 0.3% over the month. Five major grocery store food group indexes increased over the month. The index for nonalcoholic beverages increased by 1.0% in February, after a 0.4% increase the previous month.
The indexes for other food at home and for cereals and bakery products each rose 0.3% over the month. The index for fruits and vegetables increased by 0.2% in February, and the index for dairy and related products rose by 0.1%.
In contrast, the meats, poultry, fish, and eggs index fell 0.1 percent over the month, the first decrease in that index since December 2021. The index for eggs fell 6.7% in February following sharp increases in recent months.
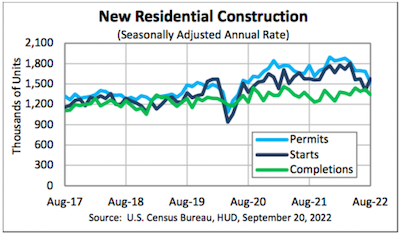
Existing Home Sales Jump in February
The National Association of Realtors reported that “existing-home sales reversed a 12-month slide in February, registering the largest monthly percentage increase since July 2020. Month-over-month sales rose in all four major U.S. regions. All regions posted year-over-year declines.
Total existing-home sales completed transactions that include single-family homes, townhomes, condominiums, and co-ops – vaulted 14.5% from January to a seasonally adjusted annual rate of 4.58 million in February.
Year-over-year, sales fell 22.6% (down from 5.92 million in February 2022).
The total housing inventory registered at the end of February was 980,000 units, identical to January and up 15.3% from one year ago (850,000).
Unsold inventory sits at a 2.6-month supply at the current sales pace, down 10.3% from January but up from 1.7 months in February 2022.”

Prices Slide After 131 Months of Gains
“The median existing-home price for all housing types in January was $363,000, a decline of 0.2% from February 2022 ($363,700), as prices climbed in the Midwest and South yet waned in the Northeast and West.
This ends a streak of 131 consecutive months of year-over-year increases, the longest on record.
Properties typically remained on the market for 34 days in February, up from 33 days in January and 18 days in February 2022.
Fifty-seven percent of homes sold in February were on the market for less than a month.
First-time buyers were responsible for 27% of sales in February, down from 31% in January and 29% in February 2022.
All-cash sales accounted for 28% of transactions in February, down from 29% in January but up from 25% in February 2022.
Distressed sales – foreclosures and short sales – represented 2% of sales in February, nearly identical to last month and one year ago.
Regional Breakdown
Existing-home sales in the Northeast improved by 4.0%, down 25.7% from February 2022. The median price in the Northeast was $366,100, down 4.5% from the previous year.
In the Midwest, existing-home sales grew 13.5%, declining 18.7% from one year ago. The median price in the Midwest was $261,200, up 5.0% from February 2022.
Existing-home sales in the South rebounded 15.9% in February, a 21.3% decrease from the prior year. The median price in the South was $342,000, an increase of 2.7% from one year ago.
In the West, existing-home sales rocketed 19.4% in February, down 28.3% from the previous year. The median price in the West was $541,100, down 5.6% from February 2022.”
Durable Goods Orders Drop Again
The U.S. Census Bureau announced the February advance report on durable goods manufacturers’ shipments, inventories, and orders:

Source: U.S. Census Bureau, Manufacturers’ Shipments, Inventories, and Orders, March 24, 2023.
New Orders
New orders for manufactured durable goods in February, down three of the last four months, decreased $2.6 billion or 1.0% to $268.4 billion.
This followed a 5.0% January decrease.
Excluding transportation, new orders were virtually unchanged.
Excluding defense, new orders decreased by 0.5%.
Also down three of the last four months, transportation equipment drove the decrease, $2.6 billion or 2.8% to $89.4 billion.
Shipments
In February, the shipment of manufactured durable goods in two consecutive months decreased by $1.5 billion or 0.6% to $274.8 billion.
This followed a 0.4% January decrease.
Also down two consecutive months, transportation equipment led the decrease, $1.3 billion or 1.4% to $90.1 billion.
Unfilled Orders
Unfilled orders for manufactured durable goods in February, down two consecutive months, decreased $1.2 billion or 0.1% to $1,155.4 billion.
This followed a virtually unchanged January decrease.
Transportation equipment, down following twenty-one consecutive monthly increases, led the decrease, $0.7 billion or 0.1% to $683.8 billion.
Inventories
Inventories of manufactured durable goods in February, up twenty-four of the last twenty- five months, increased $0.9 billion or 0.2% to $493.6 billion.
This followed a 0.2% January decrease.
Up three of the last four months, transportation equipment led the increase, $0.6 billion or 0.4% to $158.8 billion.
Capital Goods
Nondefense new orders for capital goods in February decreased $1.0 billion or 1.2% to $82.0 billion.
Shipments decreased by $0.5 billion or 0.6% to $83.2 billion.
Unfilled orders decreased by $1.2 billion or 0.2% to $662.6 billion.
Inventories increased by $0.5 billion or 0.2% to $218.8 billion.
Defense new orders for capital goods in February decreased $1.2 billion or 7.4% to $14.5 billion.
Shipments decreased by $0.2 billion or 1.6% to $14.6 billion.
Unfilled orders decreased by $0.2 billion or 0.1% to $188.9 billion.
Inventories increased by $0.1 billion or 0.3% to $23.3 billion.
Sources: dol.gov; nar.realtor; umich.edu; census.gov; bea.gov; fidelity.com; msci.com; nasdaq.com; wsj.com; morningstar.com
Partnering with Outside The Box Financial Planning offers numerous benefits for individuals seeking retirement planning, small business support, wealth management, and beyond. With their fiduciary duty, comprehensive approach, unbiased advice, transparent fee structure, and ongoing support, OTBFP act as a trusted advisor who prioritizes your best interests. Click here to schedule a complimentary “Fit” meeting to determine if we would make a good mutual fit.
Remember, financial decisions have long-lasting implications, and working with a professional can provide the expertise and guidance necessary to make informed choices that align with your financial aspirations.
However, if you would like to take a shot at building a financial plan on your own, we offer our financial planning software, RightCapital, free of charge. Click here to get started.