Posts tagged market commentary
Q3 2022 Market Commentary

Global Market Commentary: Third Quarter 2022

Markets Have Awful Third Quarter

Global equity markets had an awful third quarter, and when the final Wall Street bell weakly tolled on Friday, September 30th, all major global equity markets were in the red, leading to overall market declines not seen in decades.

Further, entering the fourth quarter of 2022, the DJIA and S&P 500 are both at their lowest since November 2020, while NASDAQ is at its lowest since the end of July 2020.

For the third quarter of 2022:

  • The DJIA dropped 6.7%;

  • The S&P 500 lost 5.3%;

  • NASDAQ lost 4.1%; and

  • The Russell 2000 declined by 3.6%.

The themes that drove market performance in the third quarter were the same worries that drove markets in the first two quarters and toward the end of last year. And the two most dominant themes continue to be inflation and the Fed – with the former rising to 40-year highs and the latter causing Wall Street to worry that the course of rising rates would lead to a recession.

The other themes were at odds with one another at times: rising consumer and investor confidence; rising food and gas prices, negative GDP numbers, a cooling-off of the housing market, better than expected manufacturing data; not-so-great corporate earnings, continued supply-chain bottlenecks and more social unrest.

Further, we saw that:

  • Volatility, as measured by the VIX, trended up this quarter, beginning the quarter under 27 and ending the month over 31, although there was a dip in the middle of the quarter.

  • West Texas Intermediate crude trended down for the quarter, starting at just over $105/barrel and ending the quarter at just under $80, slightly higher than where it stood one year ago.

Market Performance Around the World

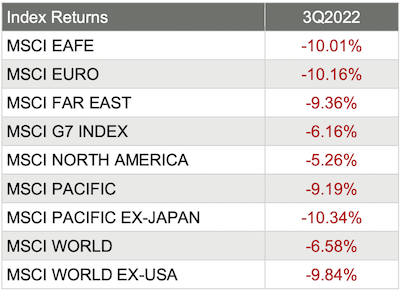
Investors were unhappy with the quarterly performance worldwide, as all 36 developed markets tracked by MSCI were negative for the third quarter of 2022 – with most recording negative returns in the double digits. And for the 40 developing markets tracked by MSCI, 38 of them were negative too, with only the EM Latin America and EFM Latin America and Caribbean Index both gaining about 1%.

Source: MSCI. Past performance cannot guarantee future results

Sector Performance Rotated in Q22022

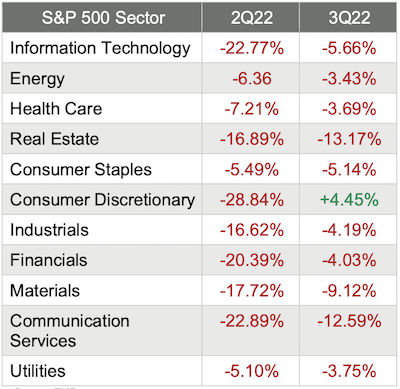
The overall trend for sector performance for the third quarter was ugly, as 10 of the 11 S&P 500 sectors dropped, with only Consumer Discretionary staying positive. And as if those numbers weren’t bad enough, the performance leaders and laggards rotated throughout the quarter, and the ranges were substantial.

Here are the sector returns for the second and third quarters of 2022:

Source: FMR

Reviewing the sector returns for just the third quarter of 2022 and the first nine months of the year, we saw that:

  • Almost all sectors were painted red for the third quarter, with only the Consumer Discretionary sector painted green;

  • 2 of the 11 sectors saw double-digit declines in the third quarter, whereas 7 recorded a double-digit decline in Q2;

  • The interest-rate sensitive sectors (Information Technology, Financials, and Real Estate specifically) struggled as the Fed raised rates; and

  • The differences between the best (+4%) performing and worst (-13%) performing sectors in the third quarter were big.

GDP Down in 2nd Quarter

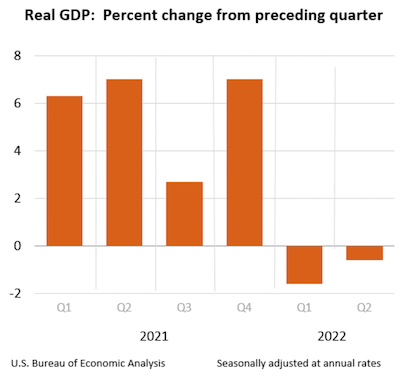
The Bureau of Economic Analysis released its third estimate of 2nd quarter's GDP and announced that it decreased at an annual rate of 0.6%, following a decrease of 1.6% in the first quarter. This third estimate was the same as was announced in the second estimate in August.

  • The smaller decrease in the second quarter, compared to the first quarter, reflected an upturn in exports and an acceleration in consumer spending.

  • Profits increased 4.6% at a quarterly rate in the second quarter after increasing 0.1% in the first quarter.

  • Private goods-producing industries decreased by 10.4%, private services-producing industries increased by 2.0%, and government decreased by 0.2%.

  • Overall, 9 of 22 industry groups contributed to the second-quarter decline in real GDP.

Housing Was Mixed

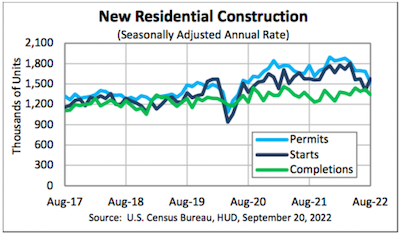
On September 20th, the U.S. Census Bureau and the U.S. Department of Housing and Urban Development jointly announced the following new residential construction statistics for August 2022:

Building Permits

  • Privately‐owned housing units authorized by building permits in August were at a seasonally adjusted annual rate of 1,517,000.

  • This is 10.0% below the revised July rate of 1,685,000 and 14.4% below the August 2021 rate of 1,772,000.

  • Single‐family authorizations in August were at a rate of 899,000; this is 3.5% below the revised July figure of 932,000.

  • Authorizations of units in buildings with five units or more were at a rate of 571,000 in August.

Housing Starts

  • Privately‐owned housing starts in August were at a seasonally adjusted annual rate of 1,575,000.

  • This is 12.2% above the revised July estimate of 1,404,000 but is 0.1% below the August 2021 rate of 1,576,000.

  • Single‐family housing starts in August were at a rate of 935,000; this is 3.4% above the revised July figure of 904,000.

  • The August rate for units in buildings with five units or more was 621,000.

Housing Completions

  • Privately‐owned housing completions in August were at a seasonally adjusted annual rate of 1,342,000.

  • This is 5.4% below the revised July estimate of 1,419,000 but is 3.1% above the August 2021 rate of 1,302,000.

  • Single‐family housing completions in August were at a rate of 1,017,000; this is 0.4% above the revised July rate of 1,013,000.

  • The August rate for units in buildings with five units or more was 318,000.

Mortgage Rates Jump

According to data compiled by Bankrate on the last day of the quarter:

  • 30-year fixed rate: 6.83%

  • 15-year fixed rate: 6.00%

  • 5/1 ARM rate: 5.22%

  • 30-year fixed jumbo fixed rate: 6.81%

Producer Price Index Drops

The Producer Price Index for final demand fell 0.1% in August, seasonally adjusted, the U.S. Bureau of Labor Statistics reported. Final demand prices decreased by 0.4% in July and advanced by 1.0% in June.

On an unadjusted basis, the index for final demand moved up 8.7% for the 12 months that ended in August.

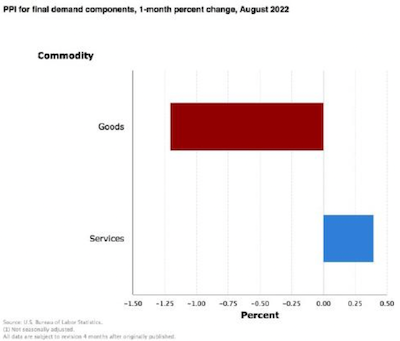
In August, the decrease in the index for final demand is attributable to a 1.2% decline in prices for final demand goods. In contrast, the index for final demand services advanced by 0.4%.

  • Prices for final demand fewer foods, energy, and trade services moved up 0.2% in August following a 0.1% rise in July.

  • For the 12 months that ended in August, the index for final demand for fewer foods, energy, and trade services increased by 5.6%.

Final Demand

Final demand goods: The index for final demand goods fell 1.2% in August after declining 1.7% in July. The August decrease can be traced to a 6.0% price drop for final demand energy. Conversely, the index for final demand goods, fewer foods, and energy rose 0.2%, while prices for final demand foods were unchanged.

Product detail: In August, over three-quarters of the decrease in prices for final demand goods is attributable to the index for gasoline, which fell 12.7%.

Prices for diesel fuel, jet fuel, chicken eggs, primary basic organic chemicals, and home heating oil also declined. In contrast, the index for construction machinery and equipment increased by 2.6%. Prices for beverages and beverage materials and for electric power also rose.

Final demand services: The index for final demand services increased by 0.4% in August, the fourth consecutive rise. Sixty% of the August advance can be traced to a 0.8%increase in margins for final demand trade services. (Trade indexes measure changes in margins received by wholesalers and retailers.) Prices for final demand services, less trade, transportation, and warehousing, also moved higher, rising 0.3%. Conversely, the index for final demand transportation and warehousing services decreased by 0.2%.

Product detail: Forty percent of the price increase for final demand services can be attributed to margins for fuels and lubricants retailing, which rose 14.2%. The indexes for securities brokerage, dealing, investment advice, and related services; loan services (partial); transportation of passengers (partial); portfolio management; and chemicals and allied products wholesaling also increased. In contrast, prices for truck transportation of freight decreased by 1.9%. The indexes for guestroom rental and for food and alcohol retailing also fell.

Leading Indicators Drop

The Conference Board Leading Economic Index for the U.S. decreased by 0.3% in August 2022 to 116.2 (2016=100) after declining by 0.5% in July. The LEI fell 2.7% over the six-month period between February and August 2022, a reversal from its 1.7% growth over the previous six months.

From the Conference Board release:

“The US LEI declined for a sixth consecutive month, potentially signaling a recession. Among the index’s components, only initial unemployment claims and the yield spread contributed positively over the last six months—and the contribution of the yield spread has narrowed recently.

“Furthermore, labor market strength is expected to continue moderating in the months ahead. Indeed, the average workweek in manufacturing contracted in four of the last six months—a notable sign, as firms reduce hours before reducing their workforce. Economic activity will continue slowing more broadly throughout the US economy and is likely to contract. A major driver of this slowdown has been the Federal Reserve’s rapid tightening of monetary policy to counter inflationary pressures. The Conference Board projects a recession in the coming quarters.”

Further:

  • The Conference Board Coincident Economic Index for the U.S. increased by 0.1%in August 2022 to 108.7 (2016=100), after increasing by 0.5% in July.

  • The CEI rose by 0.6% over the six-month period from February to August 2022, slower than its growth of 1.5% over the previous six-month period.

  • The Conference Board Lagging Economic Index for the U.S. increased by 0.7% in August 2022 to 115.4

Consumer Confidence Up

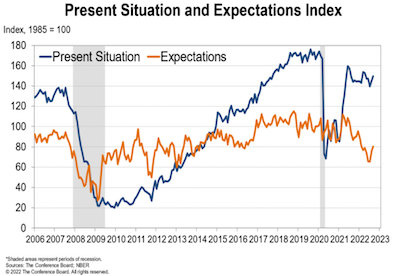
The Conference Board’s Consumer Confidence Index increased in September for the second consecutive month. The Index now stands at 108.0 (1985=100), up from 103.6 in August.

  • The Present Situation Index – based on consumers’ assessment of current business and labor market conditions – rose to 149.6 from 145.3 last month.

  • The Expectations Index – based on consumers’ short-term outlook for income, business, and labor market conditions – increased to 80.3 from 75.8.

Present Situation

Consumers’ appraisal of current business conditions was more favorable in September.

  • 20.8% of consumers said business conditions were “good,” up from 19.0%.

  • 21.2% of consumers said business conditions were “bad,” down from 22.6%.

Consumers’ assessment of the labor market improved.

  • 49.4% of consumers said jobs were “plentiful,” up from 47.6%.

  • 11.4% of consumers said jobs were “hard to get,” down slightly from 11.6%.

Expectations Six Months Hence

Consumers were more positive about the short-term business conditions outlook in September.

  • 19.3% of consumers expect business conditions to improve, up from 17.3%.

  • 21.0% expect business conditions to worsen, down from 21.7%.

Consumers were more optimistic about the short-term labor market outlook.

  • 17.5% of consumers expect more jobs to be available, up from 17.1%.

  • 17.7% anticipate fewer jobs, down from 19.6%.

Consumers were mixed about their short-term financial prospects.

  • 18.4% of consumers expect their incomes to increase, up from 16.6%.

  • Conversely, 14.3% expect their incomes will decrease, up from 13.9%.

Investor Consumer Rises

“The Global Investor Confidence Index increased to 108.8, up 1.5 points from August’s revised reading of 107.3. The increase was led by a 7.7-point jump in Asian ICI to 100.1. North American ICI rose as well, up 2.4 points to 109. European ICI, meanwhile, fell 5.5 points to 100.1.”

The release further stated:

“Despite heightened equity market volatility experienced globally, risk sentiment expressed by institutional investors remained steady in September as the Global ICI rose slightly to 108.8. As anticipated, European investors were rattled by a continued energy crisis, diminishing growth prospects, and hawkish global central banks; as a result, the EMEA ICI tumbled 5.9 points. Going forward, it will be important to monitor whether the dip in European investor confidence persists, given the market’s negative reaction to the UK’s recent fiscal plans. Overall, the increase in the September Global ICI can be largely attributed to Asia-Pacific investors as risk appetite grew in tandem with the reopening of borders and easing of restrictions in Macau and Chengdu, China.”

Consumer Sentiment

“Consumer sentiment confirmed the preliminary reading earlier this month and was essentially unchanged from the month prior, at less than one index point above August. Buying conditions for durables and the one-year economic outlook continued lifting from the extremely low readings earlier in the summer, but these gains were largely offset by modest declines in the long run outlook for business conditions. As seen in the chart, sentiment for consumers across the income distribution has declined in a remarkably close fashion for the last 6 months, reflecting shared concerns over the impact of inflation, even among higher-income consumers who have historically generated the lion's share of spending.”

The median expected year-ahead inflation rate declined to 4.7%, the lowest reading since last September. At 2.7%, median long run inflation expectations fell below the 2.9-3.1% range for the first time since July 2021. Inflation expectations are likely to remain relatively unstable in the months ahead, as consumer uncertainty over these expectations remained high and is unlikely to wane in the face of continued global pressures on inflation.

Compensation Up

Compensation costs for civilian workers increased 1.3%, seasonally adjusted, for the 3-month period ending in June 2022, the U.S. Bureau of Labor Statistics reported.

  • Wages and salaries increased 1.4% and benefit costs increased 1.2% from March 2022.

  • Compensation costs for civilian workers increased 5.1% for the 12-month period ending in June 2022 and increased 2.9% in June 2021.

  • Wages and salaries increased 5.3% for the 12-month period ending in June 2022 and increased 3.2% for the 12-month period ending in June 2021.

  • Benefit costs increased 4.8% over the year and increased 2.2% for the 12-month period ending in June 2021.


Partnering with Outside The Box Financial Planning offers numerous benefits for individuals seeking retirement planning, small business support, wealth management, and beyond.  With their fiduciary duty, comprehensive approach, unbiased advice, transparent fee structure, and ongoing support, OTBFP act as a trusted advisor who prioritizes your best interests. Click here to schedule a complimentary “Fit” meeting to determine if we would make a good mutual fit.

Remember, financial decisions have long-lasting implications, and working with a professional can provide the expertise and guidance necessary to make informed choices that align with your financial aspirations. 

However, if you would like to take a shot at building a financial plan on your own, we offer our financial planning software, RightCapital, free of charge. Click here to get started.
Q1 2022 Market Commentary

Global Market Commentary: First Quarter 2022

Markets Have Worst Quarter Since 1Q2020

Global equity markets had a volatile first quarter and when the final Wall Street bell rang on March 31st, global equity markets were in the red, as March was not enough to make up for the dismal returns from January and February.

But maybe the worst news was that the bond market suffered its worst quarter since 1980.

For the first quarter of 2022:

  • The DJIA ended Q1 with a loss of 5.2%;

  • The S&P 500 ended Q1 with a loss of 5.5%;

  • NASDAQ ended Q1 with a loss of 10.2%; and

  • The Russell 2000 ended Q1 with a loss of 8.9%.

The themes that drove market performance in the first quarter were the same themes that drove markets toward the end of last year. But in late February and throughout all of March, Wall Street dealt with the invasion of Ukraine by Russia and its impact on global markets.

Volatility and oil prices spiked this quarter, driven by a host of issues, including Russia’s invasion, rising inflation, supply chain issues and the Federal Reserve’s timing and size of rate hikes (we saw a 25 basis point hike in March).

The other themes were volatile consumer confidence, continued red-hot housing prices, high GDP growth numbers and corporate earnings that came in better than expected.

Further, we saw that:

  • Volatility, as measured by the VIX, trended up most of the month, more than doubling to a high of 36 on March 7th, before retreating to come to rest marginally higher than where it began the month.

  • West Texas Intermediate crude made a big move in the first quarter, starting at $75/barrel and ending the quarter at over $100. For perspective, WTI started 2021 at $48/barrel.

Market Performance Around the World

Investors were unhappy with the quarterly performance around the world, as 35 of the 36 developed markets tracked by MSCI were negative for the first quarter of 2022, with only MSCI Pacific ex-Japan advancing. And for the 40 developing markets tracked by MSCI, 26 of them were negative, with many posting staggering losses, including MSCI Eastern Europe that dropped almost 60%.

Source: MSCI. Past performance cannot guarantee future results

March Could Not Lift the Entire Quarter

U.S. equity markets reversed the negative course of the quarter’s first two months and ended March in positive territory. But it was still not enough to overcome the biggest two-month drop (January and February) since March 2020 as markets ended the 1st quarter of 2022 in the red - the first since the 1st quarter of 2020.

For the month of March:

  • The DJIA was up 4.2%;

  • The S&P 500 was up 5.2%;

  • NASDAQ was up 5.1%; and

  • The Russell 2000 was up 3.1%.

Sector Performance Rotated in Q12022

The overall trend for sector performance for all 3 months so far in 2022 was mixed and the performance leaders and laggards rotated throughout, giving investors a few mini sector rotations each month and during the quarter.

Here are the sector returns for the shorter time periods:

Source: FMR

Reviewing the sector returns for just the first quarter of 2022, we saw that:

  • 9 of the 11 sectors were painted red for the first quarter, which is in stark comparison to the previous quarter;

  • The Energy sector turned in an astonishing quarter, driven by a massive jump in oil prices;

  • The defensive Utilities sector turned in a good quarter;

  • The interest-rate sensitive sectors (Information Technology and Financials specifically) struggled as the Fed raised rates by 25 bps; and

  • The differences between the best (+38%) performing and worst (-13%) performing sectors in the first quarter widened.

The Fed Increases Rates

The dominant theme this month (besides Russia/Ukraine) revolved around whether the Fed might need to raise short-term interest rates more quickly and more often, eating into future profits, especially within the high-flying tech names.

Then at the March meeting, the Federal Reserve moved its fed funds target rate from near zero to a range of 0.25% to 0.50%. It was the first rate hike since 2018.

The Federal Funds Rate – 10 Year Chart

But the Fed also released the so-called “dot plot,” which shows where individual Fed officials expect interest rates to be.

And given the surge in inflation numbers – from the perspectives of both consumers (CPI) and producers (PPI), the majority now expect seven hikes in 2022, four in 2023 and none for 2024. (In other words, there could be a rate hike at every remaining Fed meeting this year and at half the meetings next year.)

If this comes true, it would be higher than the Fed’s estimate of the long-run neutral rate, (which is 2%), and would suggest a more hawkish policy that could be more restrictive to growth.

Interestingly enough, when the Fed raised rates 25 basis points and released its “dot plot,” stocks rallied, suggesting that Wall Street appreciates the path that has been outlined.

But The Fed Was Not Unanimous

By its own metrics, however, it was becoming increasingly difficult for the Fed to forestall a rate increase at least in the range of 0.25%.

In fact, buried in a footnote of the Fed’s statement was this nugget:

“Voting against this action was James Bullard, who preferred at this meeting to raise the target range for the federal funds rate by 0.5 percentage points to 1/2 to 3/4 percent.”

Bond Markets Struggle

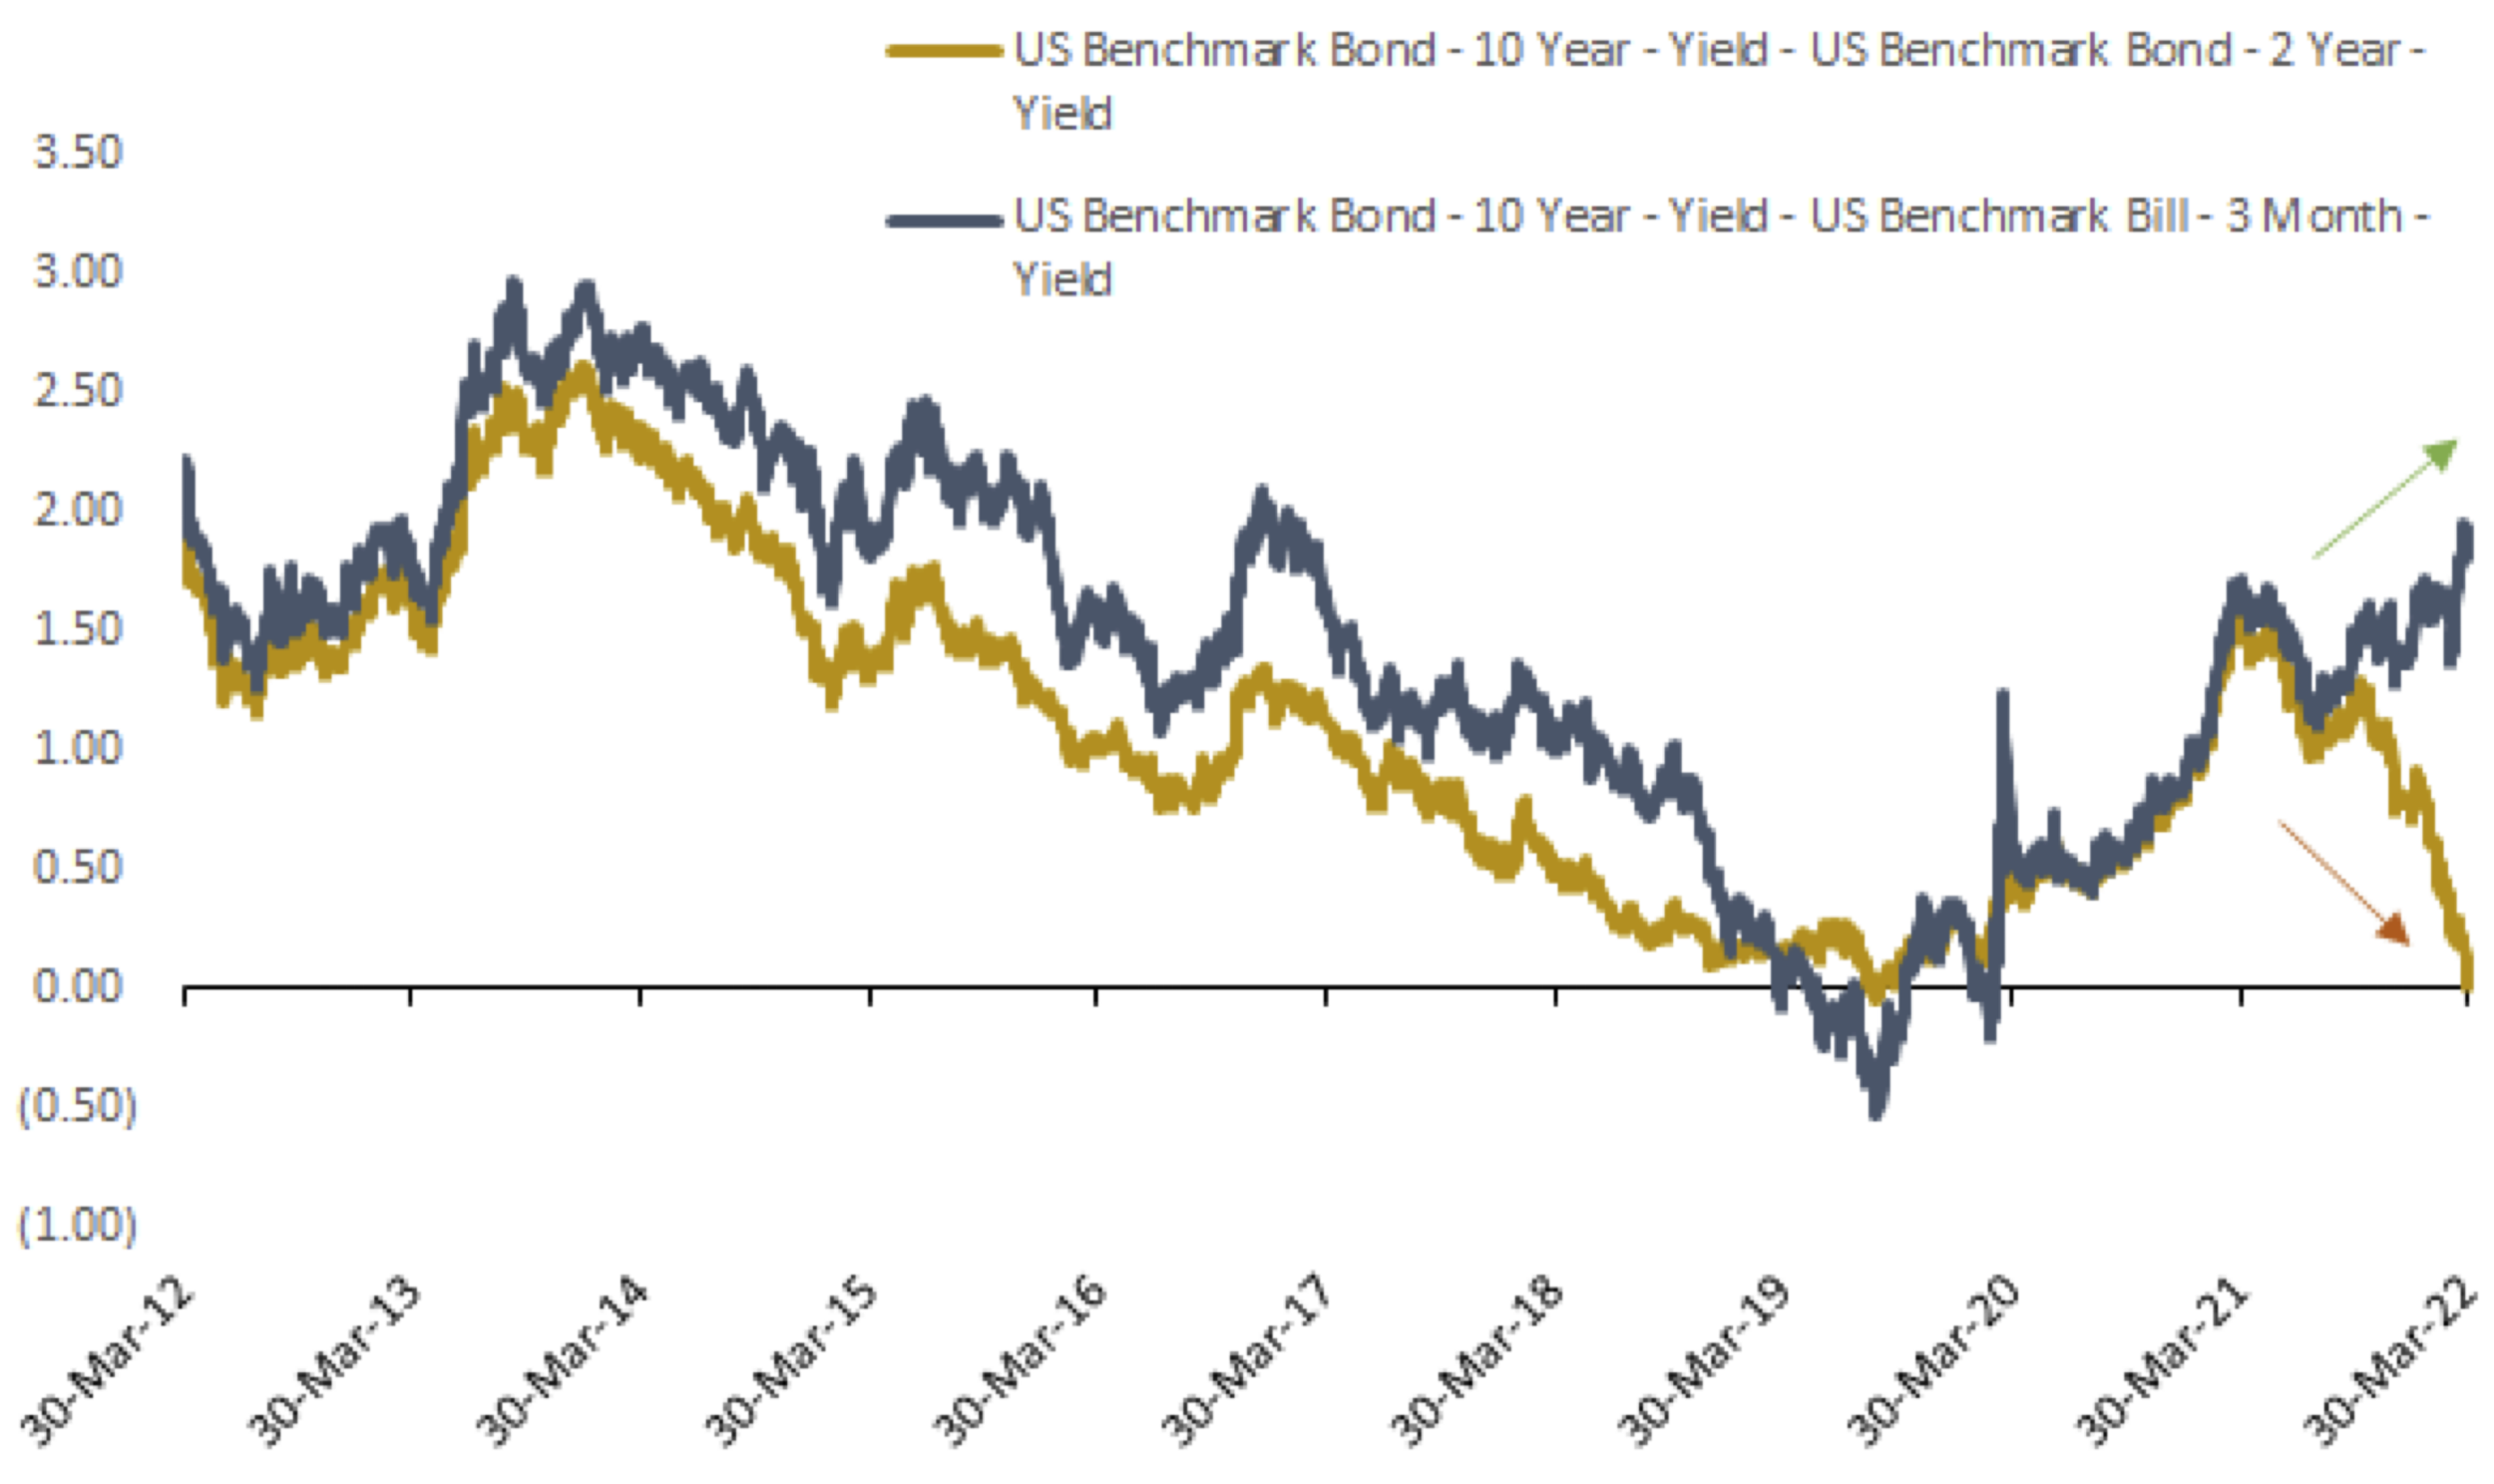
At the end of the quarter, there was a lot of chatter because the 2-year Treasury yield and the 10-year Treasury yield inverted, leading many to suggest a recession is on the way in the next 12 months.

10YR-2YR Treasury curve and 10YR-3MTH Treasury curve (%)

But lost in much of the quarter-end summaries was this ominous sign: the bond market suffered its worst quarter since 1980. Specifically, the Bloomberg U.S. Aggregate Bond Index had its worst quarter since late 1980.

Want more bad bond news? Well,

  • The first quarter of 2022 was the third-worst quarter since the index’s inception.

  • March was the worst monthly performance for the index since July 2003.

GDP UP 6.9% Last Quarter

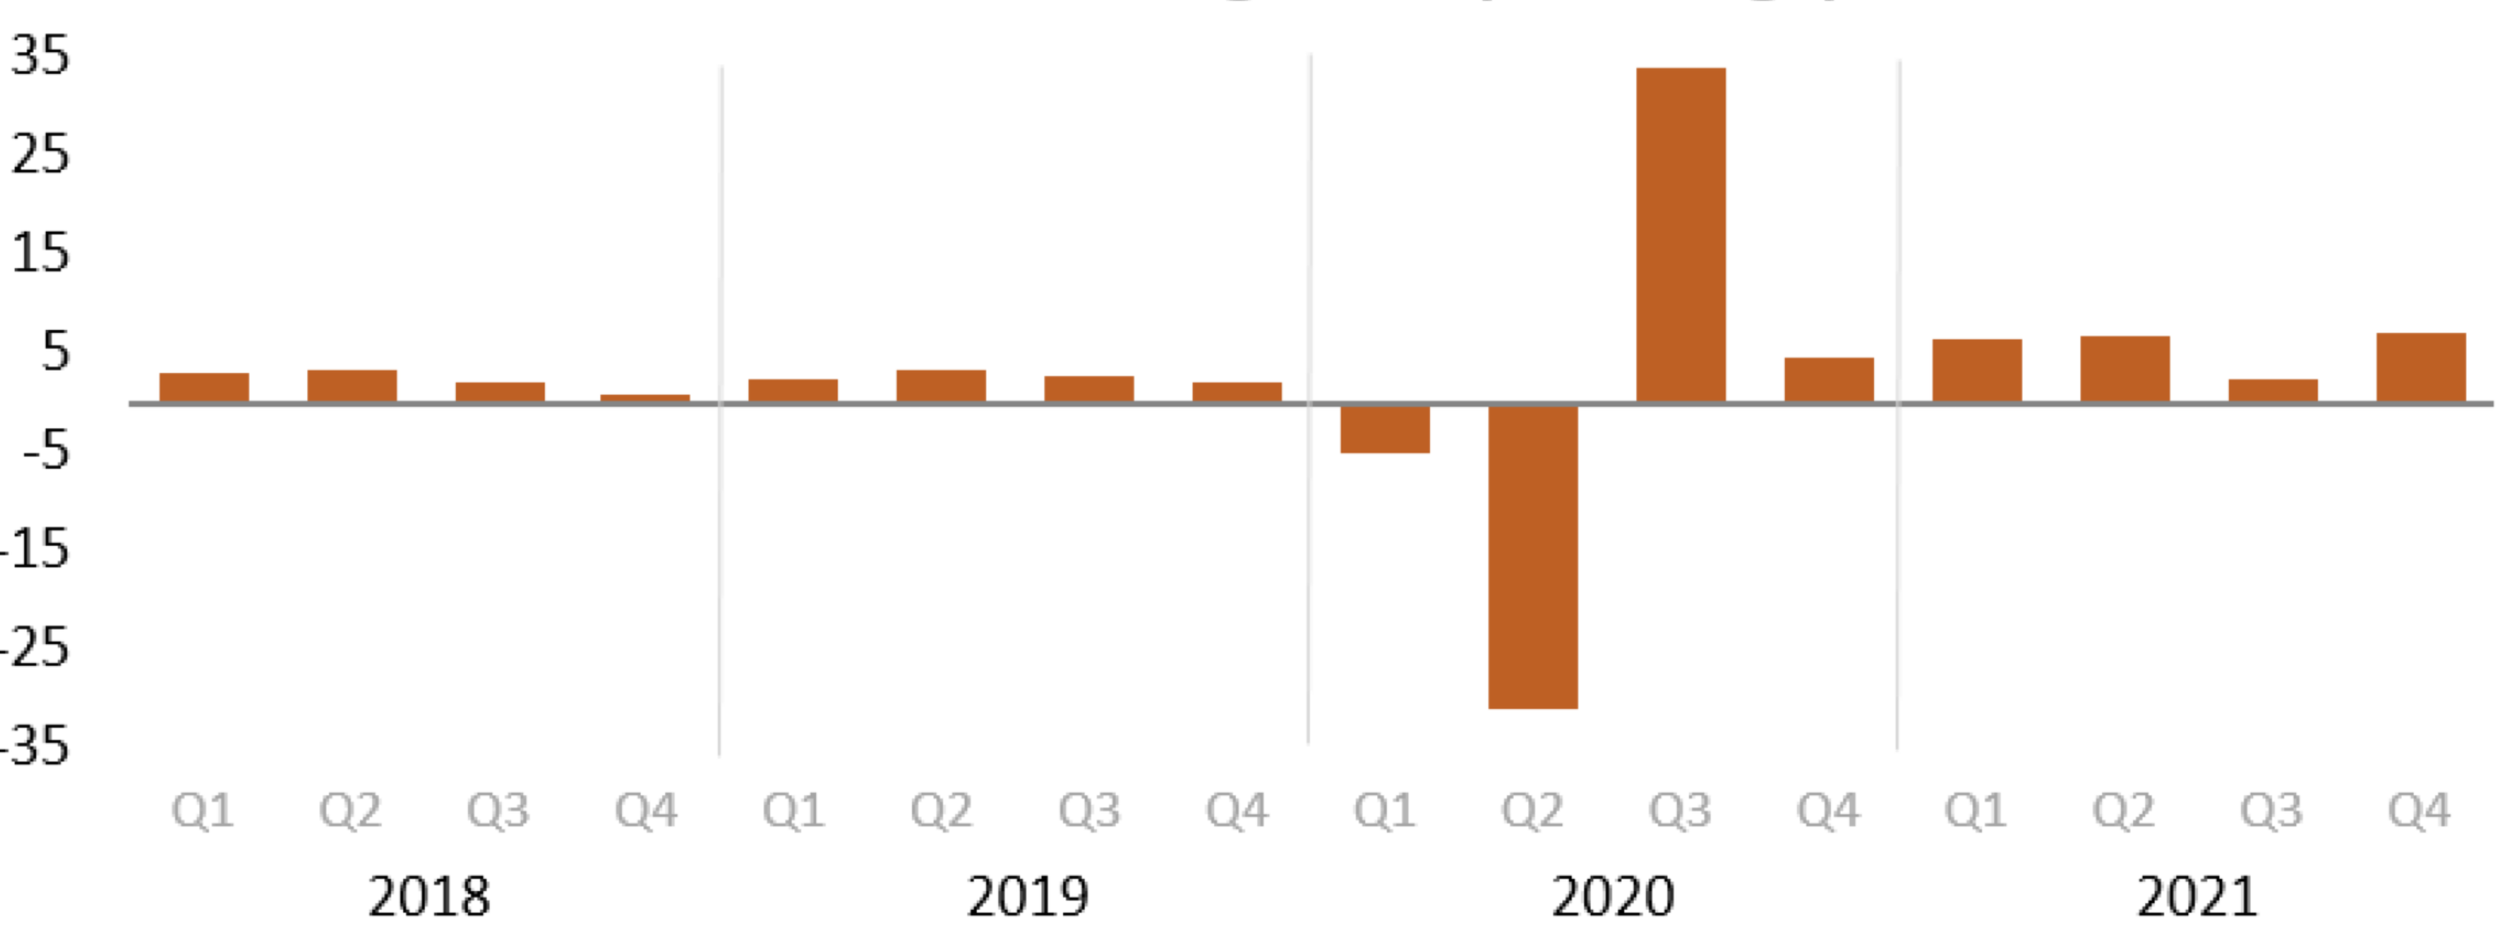
Two days before the quarter ended, the Bureau of Economic Analysis reported that real gross domestic product increased at an annual rate of 6.9% in the fourth quarter of 2021.

In the third quarter, real GDP increased 2.3 percent.

U.S. Bureau of Economic Analysis. Seasonally adjusted at annual rates.

PCE Price Index Up 6.4% Over 12 Months

The Bureau of Economic Analysis reported a lot of information on the last day of the quarter, including that:

  • Personal income increased $101.5 billion (0.5%) in February

  • Disposable personal income increased by $76.1 billion (0.4%)

  • Personal consumption expenditures increased $34.9 billion (0.2%)

Further:

  • Real DPI decreased 0.2% in February and Real PCE decreased 0.4%

  • Goods decreased 2.1%

  • Services increased 0.6%

  • The PCE price index increased 0.6%

  • Excluding food and energy, the PCE price index increased 0.4%

The PCE price index for February increased 6.4% from one year ago, reflecting increases in both goods and services.

  • Energy prices increased 25.7%

  • Food prices increased 8.0%

  • Excluding food and energy, the PCE price index for February increased 5.4% from one year ago

Personal Consumption Expenditures Price Index, Ex-Food and Energy

Change from Month One Year Ago

February 2022 5.4%

January 2022 5.2%

December 2021 4.9%

November 2021 4.7%

Unemployment is Very Low

Unemployment (3.8%) is now nearly at record lows. In addition, the number of job openings exceeds the number of unemployed by the widest margin in the past 20 years.

Record job openings exceed the number of unemployed (numbers in millions)

Source: FactSet

This paradigm suggests that we will be in a tight labor market for a while. And the jobs growth and unemployment numbers reported at the end of the quarter reinforce that notion.

Source: Bureau of Labor Statistics

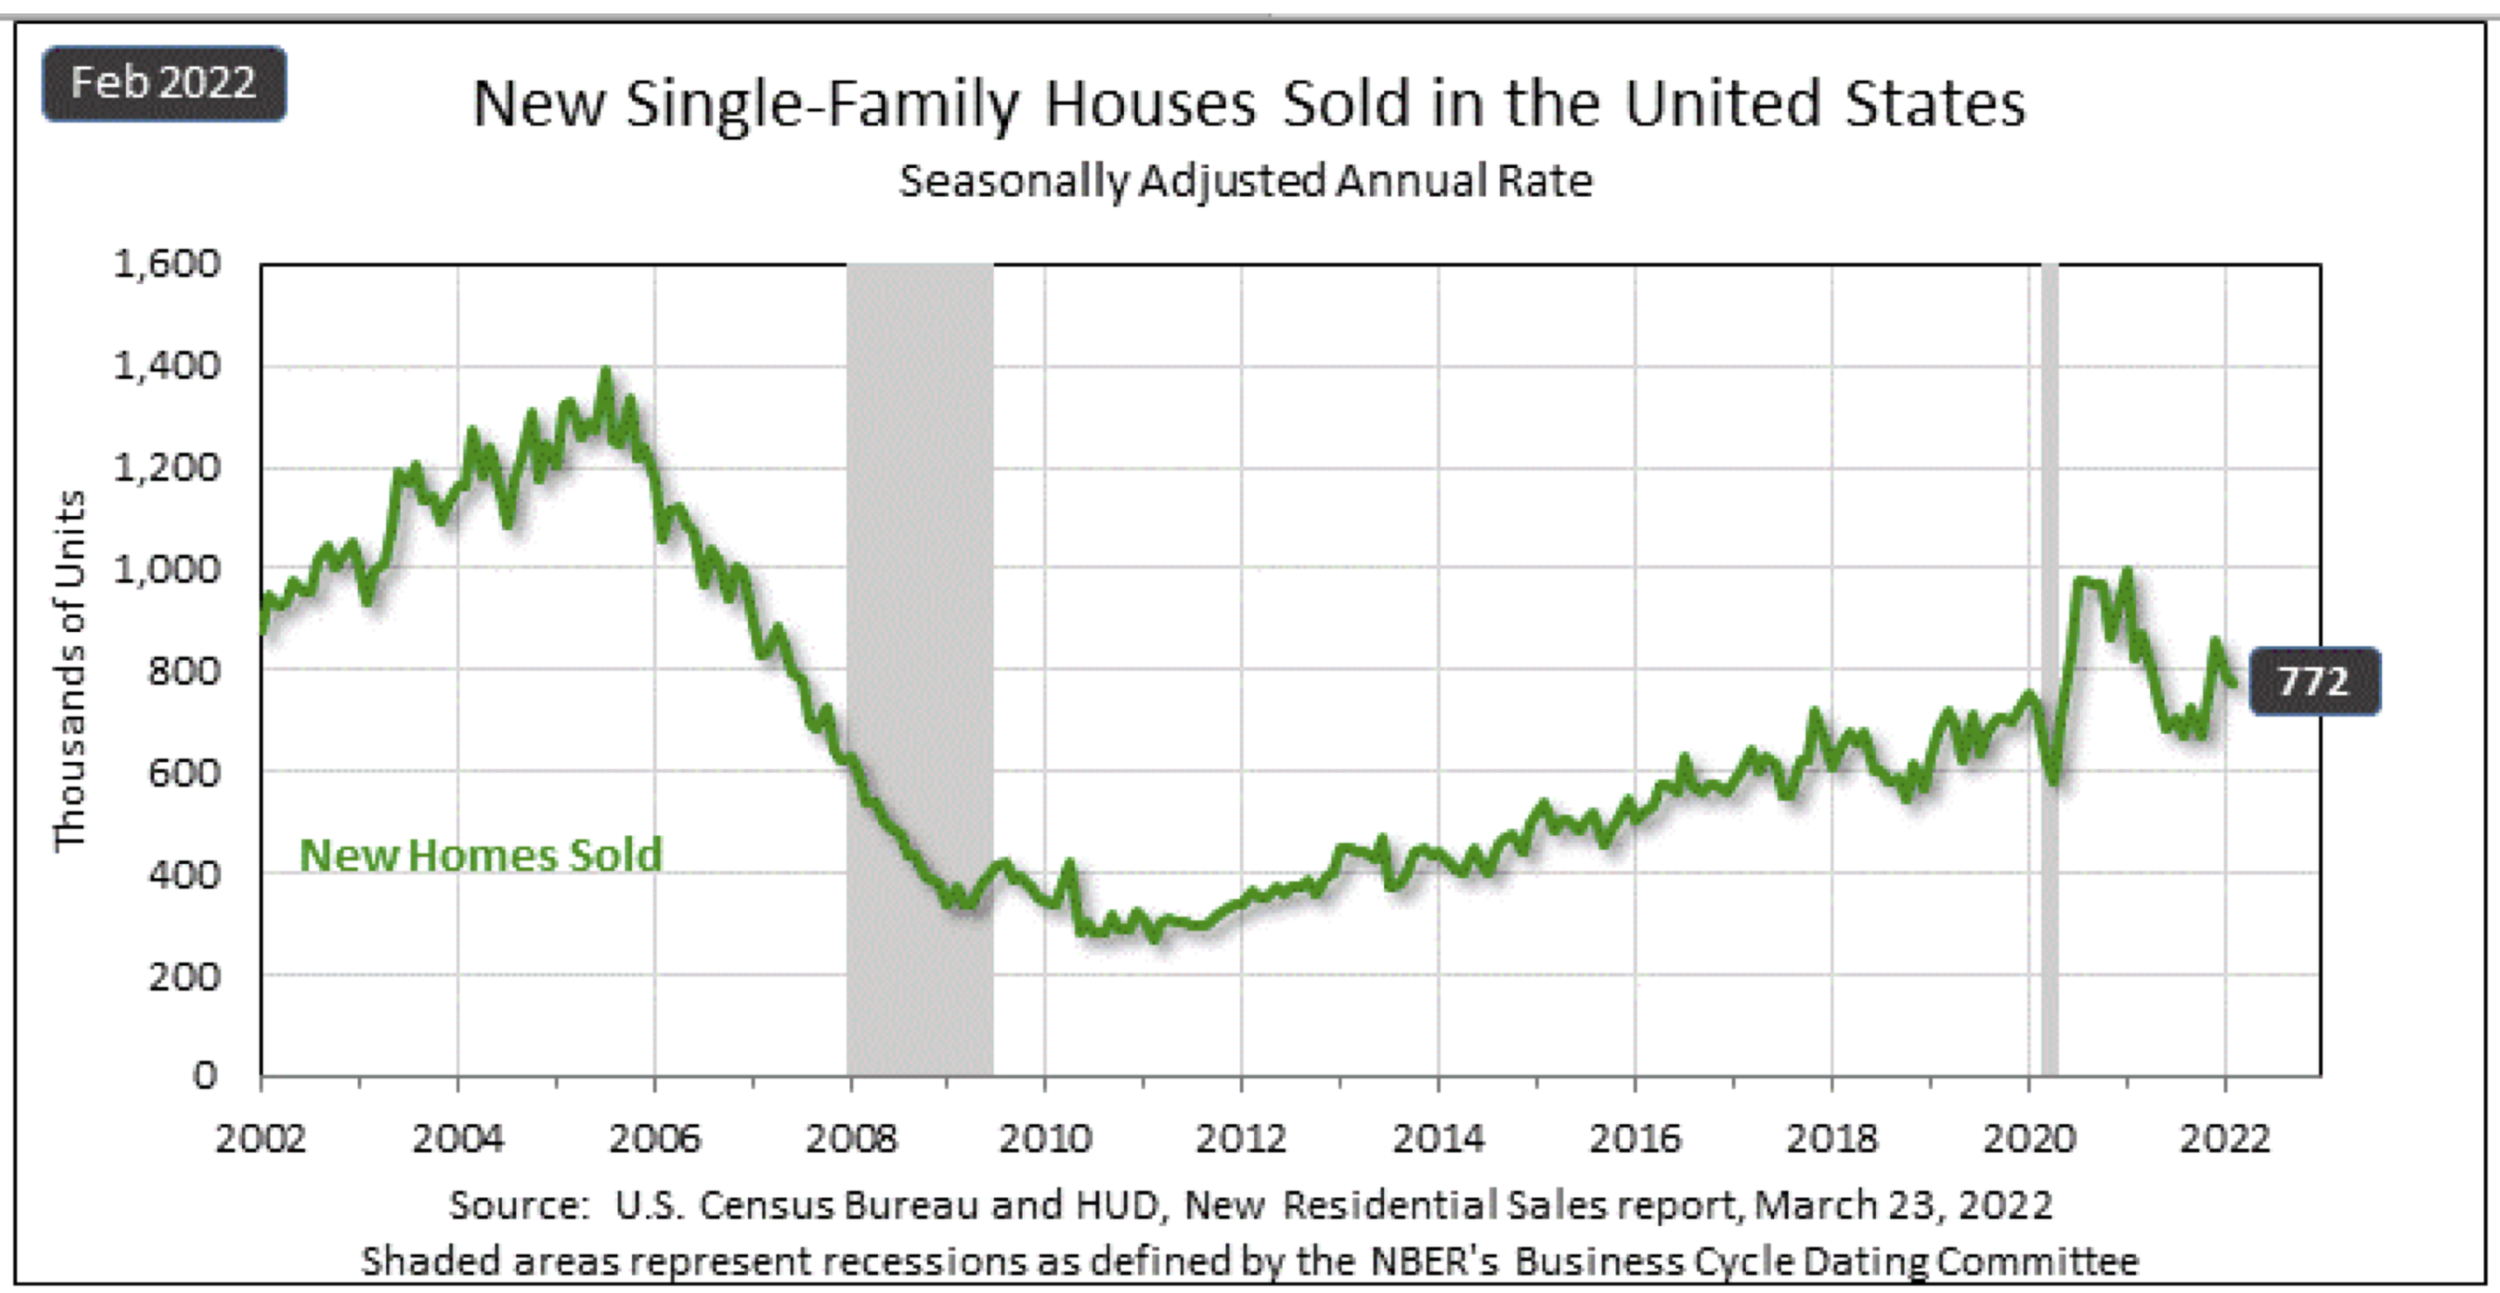
New Home Sales Down

The U.S. Census Bureau and the U.S. Department of Housing and Urban Development jointly announced the following new residential sales statistics for February 2022.

New Home Sales

  • Sales of new single‐family houses in February 2022 were at a seasonally adjusted annual rate of 772,000

  • This is 2.0% below the January rate of 788,000

  • This is 6.2% below the February 2021 estimate of 823,000

Sales Price, Inventory, and Months’ Supply

  • The median sales price of new houses sold in February 2022 was $400,600

  • The average sales price was $511,000

  • The seasonally‐adjusted estimate of new houses for sale at the end of February was 407,000

  • This represents a supply of 6.3 months at the current sales rate

Consumer Confidence is Up

The Conference Board announced that “the Consumer Confidence Index increased slightly in March, after a decrease in February. The Index now stands at 107.2 (1985=100), up from 105.7 in February. The Present Situation Index – based on consumers’ assessment of current business and labor market conditions—improved to 153.0 from 143.0 last month. However, the Expectations Index – based on consumers’ short-term outlook for income, business, and labor market conditions— declined to 76.6 from 80.8.”

Present Situation
Consumers’ appraisal of current business conditions improved in March.

  • 19.6% of consumers said business conditions

    were “good,” up from 17.6%.

  • 22.1% of consumers said business conditions were “bad,” down from 25.1%.

Consumers’ assessment of the labor market also improved.

  • 57.2% of consumers said jobs were “plentiful,” up from 53.5%, a new historical high.

  • 9.8% of consumers said jobs are “hard to get,” down from 12.0%.

Expectations Six Months Hence

Consumers’ optimism about the short-term business conditions outlook declined in March.

  • 18.7% of consumers expect business conditions will improve, down from 21.3%.

  • 23.8% expect business conditions to worsen, up from 19.9%.

Consumers were mixed about the short-term labor market outlook.

  • 17.4% of consumers expect more jobs to be available in the months ahead, down from 19.4%.

  • Conversely, 17.7% anticipate fewer jobs, down from 19.6%.

Consumers were also mixed about their short-term financial prospects.

  • 14.9% of consumers expect their incomes to increase, up from 14.7%.

  • 13.7% expect their incomes will decrease, up from 13.0%.

Sources: conference-board.org; bea.gov; census.gov; msci.com; fidelity.com; nasdaq.com; wsj.com; morningstar.com; bea.gov

2020 Global Market Commentary

2020 Global Market Commentary

1.22.21 approved - 2020 global market commentary.png

2020: A Tale of Two Markets

2020 can be summarized by the famous Charles Dickens line from A Tale of Two Cities:

“It was the best of times, it was the worst of times, it was the age of wisdom, it was the age of foolishness, it was the epoch of belief, it was the epoch of incredulity, it was the season of light, it was the season of darkness, it was the spring of hope, it was the winter of despair.”

Stock markets in the U.S. and around the globe turned in a very good year, despite two formidable headwinds that swirled around the economy and markets all year. COVID-19 and the elections of 2020 seemed to either slam markets with hurricane-like force or provide a steady wind in the market’s sails pushing markets to new record highs. There really were not many calm days.

In a nutshell, 2020 saw markets crest new highs at the beginning of the year, followed by a couple of corrections, the end of the longest bull market in history, a legitimate recession, a V-shaped recovery, and newer market highs. And along the way, we saw unemployment hit 50-year lows and then hit depression-era levels, multiple government stimulus programs, the best and worst quarterly GDP numbers of all time, a very active and aggressive Federal Reserve, social unrest throughout the country, negative oil prices, a frothy housing market and a major shift in Washington power. It was the best of times and the worst of times – in a single year.

But first, let’s do the numbers:

  • The DJIA rose 7.3% in 2020;

  • The S&P 500 rose 16.3% in 2020;

  • The Russell 2000 Index rose 19.9% in 2020; and

  • NASDAQ rose 43.6% in 2020.

Sector Returns in 2020

The overall trend for sector performance for each of the four quarters in 2020 and each of the 12 months was good, but the performance leaders and laggards did rotate all year. For example:

  • Q1 ended with every one of the 11 S&P 500 sectors turning in negative numbers;

  • Q2 ended with every one of the 11 sectors turning in positive numbers;

  • Q3 ended with 10 of the 11 positive; and

  • Q4 ended with all 11 sectors positive.

Here are the sector returns through the end of December 31, 2020:

1.22.21 approved -1 2020 global market commentary-1 (dragged).png

Reviewing the sector returns for 2020, we saw that:

  • 7 of the 11 sectors were painted green for the year;

  • The Financials sector had a wonderful final quarter, helped by the Federal Reserve’s stance of keeping rates low through 2023, although it was not enough to push the sector into positive territory for the year;

  • While the Energy sector also turned in a terrific fourth quarter, it was nowhere near enough to override its annual loss of more than 37%; and

  • On an annual basis, the difference between the best and worst-performing sectors is dramatic, as the Information Technology sector is up over 42% YTD and Energy is down a whopping 37%+.

Markets Around the World Performed Well

Strong performance in 2020 was not confined to the U.S., however, as most global markets also turned in a positive year. In fact, of the 35 of the developed markets tracked by MSCI, every single one was positive for 2020.

But that was not the case for developing markets, however, as 24 of the 40 developing markets tracked by MSCI turned in negative numbers for 2020 and the range between the best- and worst-performer was significant. To underscore the range, consider that the MSCI EM Europe Index lost 15.94% and MSCI Asia APEX 50 Index gained 31.32%. The following shows the range of 2020 returns from markets around the world:

1.22.21 approved -1 2020 global market commentary-2 (dragged).png

Asset Class & Style Performance

2020 was positive for many investors, but asset class and style played a huge role in determining total performance returns for investors.

For the year, Growth (+34.2%) outpaced Value (-0.4%) significantly and the smaller-cap names trailed their larger-cap counterparts for most of the year, although the differences between the two were mostly erased towards year-end.

Similarly, the larger emerging markets performed well, as evidenced by MSCI EM (+18.7) whereas the smaller emerging markets more often than not turned in negative numbers for the year. And Commodities and Global REITs struggled most of the year as well, eventually ending in the red.

1.22.21 approved -1 2020 global market commentary-2 (dragged) 2.png

The Federal Reserve Was in Overdrive

In dramatic and emergency actions to support the U.S. economy during the coronavirus pandemic, the Federal Reserve announced it would cut its target interest rate to near zero. And it announced its second rate cut on a Sunday no less.

The unexpected and faster-than-expected rate cut was on the heels of the Fed’s emergency 50 basis points rate cut just 12 days before – and that cut was the first time since October 2008 that our central bank decided to go ahead with a cut in between scheduled policy meetings.

Further, the Fed pledged its support to an aggressive quantitative easing program, suggesting that there was no limit on its purchases of Treasuries and agency mortgage-backed securities as well as purchasing investment-grade corporate bonds. The Fed also announced it would help maintain the flow of credit to municipalities around the country and establish a lending program for small businesses.

On top of all of that, the Fed also brokered a deal with other global central banks to lower their rates on currency swaps to bring normalcy to markets. The other central banks include the Bank of Canada, the Bank of England, the Bank of Japan, the European Central Bank, and the Swiss National Bank. And it appears that the Fed’s “zero-interest-rate-policy” will be in place through 2022 and maybe even through 2023.

Worst GDP Decline in History in 2Q

On September 30th, the Commerce Department reported that its “Third Estimate” of 2Q2020 GDP improved marginally to a decline of 31.4%. But saying it improved marginally seems disingenuous on its face because this 30%+ decline is on the heels of the 5% decline in the first quarter. And whether the number is 31.4% or 32.9% (from the second estimate), it’s still the worst quarterly decline in history – by a long shot.

1.22.21 approved -1 2020 global market commentary-3 (dragged).png

Best GDP Growth in History in 3Q

Then three days before Christmas, the U.S. Department of Commerce released the “third” estimate of real gross domestic product for the third quarter and the “third” estimate was revised upwards from 33.1% to 33.4%. This is of course on the heels of the 31.4% decrease in the second quarter.

1.22.21 approved -1 2020 global market commentary-3 (dragged) 2.png

According to the Bureau of Economic Analysis (within the Department of Commerce):

“The increase in real GDP reflected increases in PCE, private inventory investment, exports, nonresidential fixed investment, and residential fixed investment that were partly offset by decreases in federal government spending (reflecting fewer fees paid to administer the Paycheck Protection Program loans) and state and local government spending. Imports, which are a subtraction in the calculation of GDP, increased.

Wall Street Climbed a Wall of Worry

While the first quarter of 2020 was pockmarked with unprecedented and immediate stoppage of economic activity as businesses shut down and people stayed at home, every month of the second quarter of 2020 saw businesses slowly start to reopen, albeit not as fast as they shut down. The third-quarter was an extension of the third quarter, although results of the shutdowns started to show more prominently in corporate earnings reports. And the fourth quarter saw much of the same, but more negative news started to creep into various economic data sets, including housing.

While many are happy to see 2020 in the rear-view mirror, the performance for 2020 for the major U.S. indices and most of the developed, international markets was nothing short of impressive, especially given the headwinds of COVID-19 and the drama surrounding the 2020 elections. And as we enter a New Year, those headwinds have not evaporated completely, but they are beginning to diminish.

Let’s hope that 2021 is “the best of times, the age of wisdom, the epoch of belief, the season of light, and the spring of hope.”

Sources: msci.com; fidelity.com;nasdaq.com; wsj.com; morningstar.com