

Markets Have (Mostly) Good Fourth Quarter
Global equity markets had a pretty good fourth quarter – except for the tech names – and when the final Wall Street-bell weakly tolled on Friday, December 30th, most of the major global equity markets were positive, notwithstanding the pullback seen during the month of December.
Despite the overall losses for the year, the DJIA and S&P 500 did manage the first positive quarter for the year, whereas NASDAQ – dominated by the tech names – managed to see its fourth consecutive quarterly loss – its first time since 2001.
For the fourth quarter of 2022:
The DJIA advanced 15.4%;
The S&P 500 gained 7.1%;
NASDAQ lost 1.1%; and
The Russell 2000 added 3.6%.
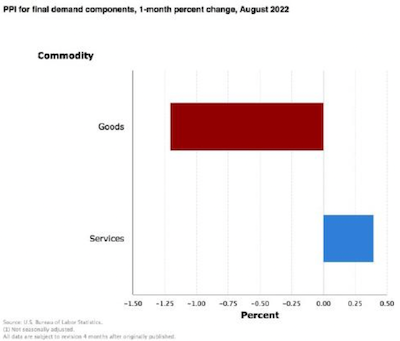
The themes that drove market performance in the 4th quarter were consistent from previous quarters – inflation fears and hopes that the Fed might slow its pace and magnitude of rate hikes. And while inflation remained stubbornly high as readings of the CPI and the PPI were improved, the Fed did reduce its 7th rate hike magnitude from 75 basis points to 50.
The other themes were at odds with one another at times: rising consumer and investor confidence; rising food and gas prices, positive GDP numbers, a cooling-off of the housing market, better-than-expected manufacturing data; not-so-great corporate earnings, and continued supply-chain bottlenecks.
Further, we saw that:
Volatility, as measured by the VIX, trended down this quarter, beginning the quarter around 31 and ending near 22, with a peak in mid-October.
West Texas Intermediate crude trended down for the quarter too, starting at just over $86/barrel and ending the quarter at just under $77, about where it stood one year ago.
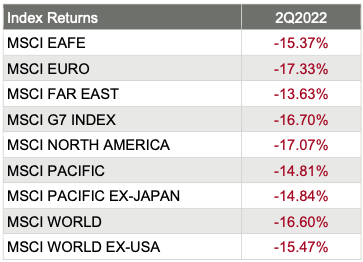
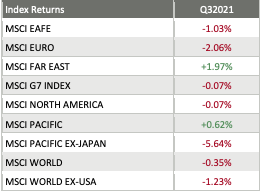
Market Performance Around the World
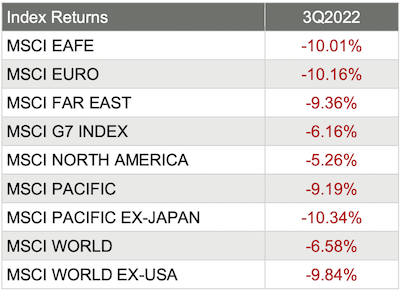
Investors were very happy with the quarterly performance around the world, as all 36 developed markets tracked by MSCI were positive for the fourth quarter of 2022 – with most recording positive returns in the double digits. And for the 40 developing markets tracked by MSCI, 38 of them were positive too, with many emerging markets in Europe gaining more than 30%.
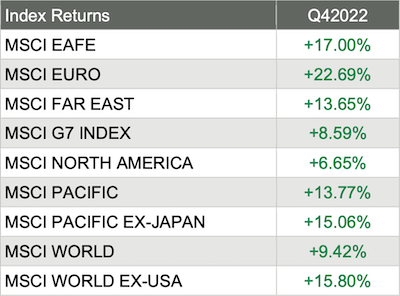
Source: MSCI. Past performance cannot guarantee future results
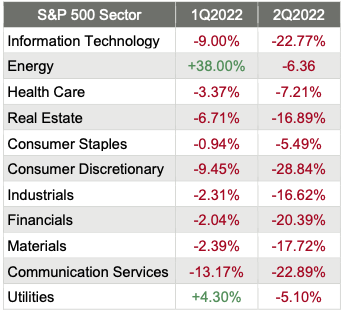
Sector Performance Rotated in Q42022
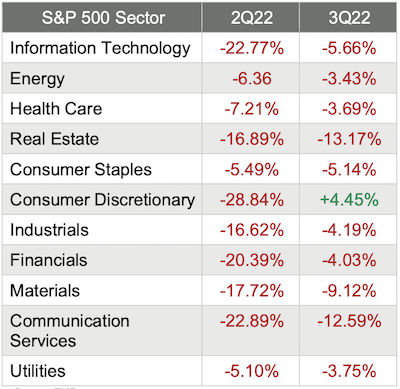
The overall trend for sector performance for the fourth quarter was good, as 9 of the 11 sectors advanced, with 6 advancing by double-digits.
Compare that to an ugly third quarter, where 10 of the 11 S&P 500 sectors dropped with only Consumer Discretionary staying positive. And as happened in each quarter last year, the performance leaders and laggards rotated throughout the quarter and the ranges were substantial.
Here are the sector returns for the third and fourth quarters of 2022:
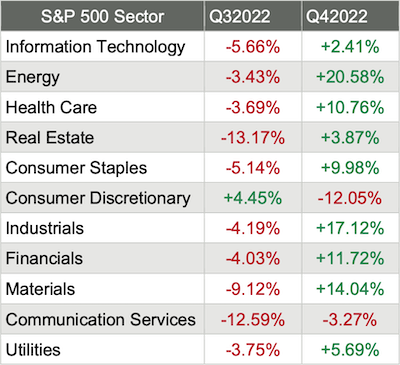
Source: FMR
Reviewing the sector returns for just the fourth quarter of 2022, we saw that:
Almost all sectors were painted green, although the Consumer Discretionary sector took a big hit;
6 of the 11 sectors saw double-digit gains in the fourth quarter, including the Energy sector which jumped more than 20%;
The defensive sectors (think Materials and Industrials) turned in a great quarter as did the interest-rate sensitive sectors (think Financials); and
The differences between the best (+20%) performing and worst (-17%) performing sectors in the fourth quarter was massive.
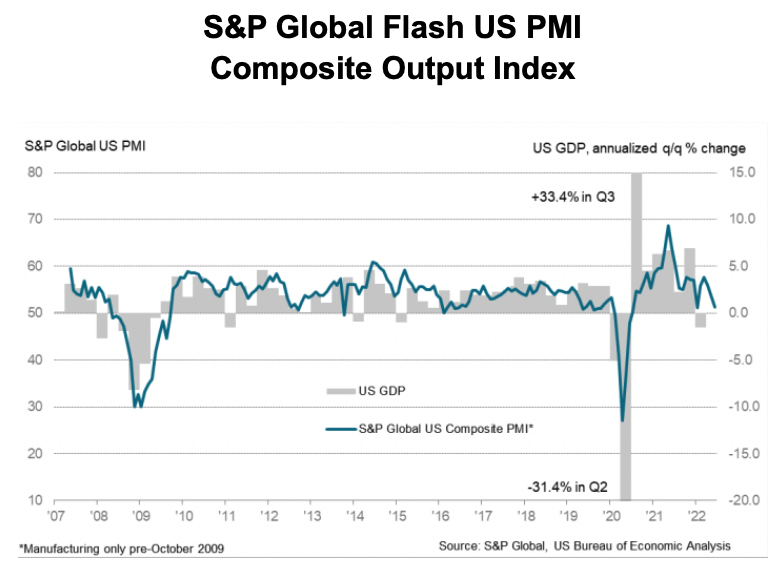
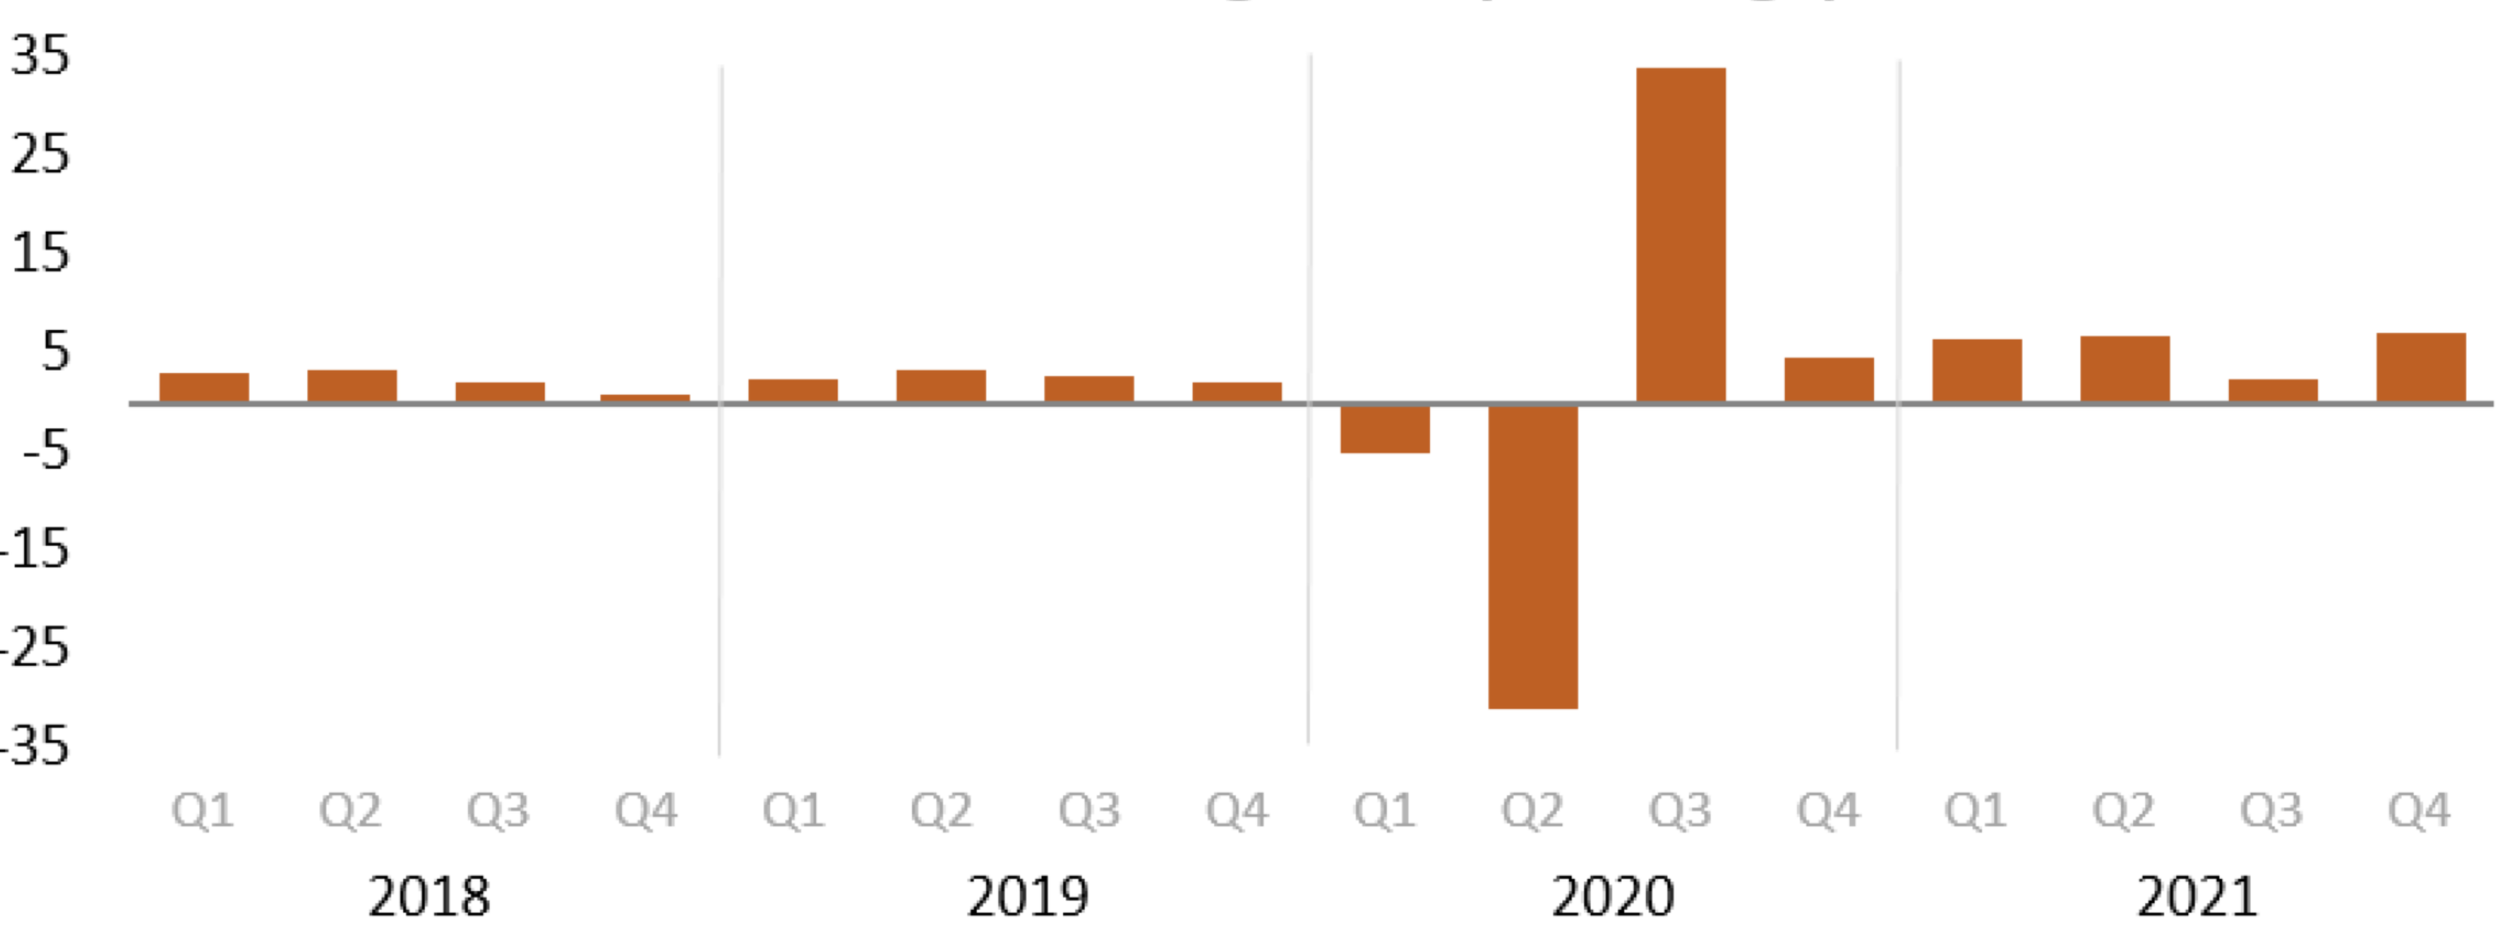
GDP Down in 3rd Quarter
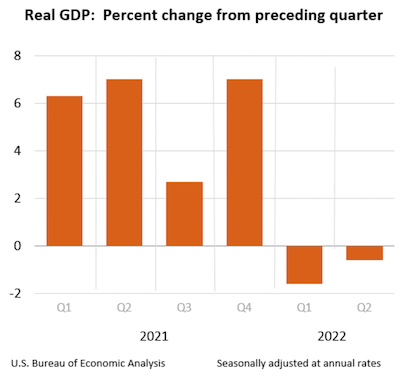
At the end of the quarter, the Bureau of Economic Analysis reported that real gross domestic product increased at an annual rate of 3.2% in the third quarter of 2022. In the second quarter, real GDP decreased 0.6%.

U.S. Bureau of Economic Analysis. Seasonally adjusted annual rates
Further: “In the third quarter of 2022, as real GDP for the nation increased at an annual rate of 3.2%, real GDP increased in 16 of the 23 industry groups for which BEA prepares quarterly state estimates.
Information services; professional, scientific, and technical services; and mining were the leading contributors to the increase in real GDP nationally.
The mining industry was the leading contributor to the increases in real GDP in Alaska, Texas, Oklahoma, Wyoming, North Dakota, and New Mexico, the six states with the largest increases in real GDP, and in West Virginia, the state with the eighth-largest increase in real GDP.
Personal income increased in all 50 states and the District of Columbia in the third quarter, with the percent change ranging from 14.2% in Colorado to 1.4% in Kentucky.
Fed Raises Rates for the 7th Time
In mid-December, the Fed announced a 50 basis points rate hike to the fed funds rate (its 7th rate hike in 2022) and then released the following statement: “Recent indicators point to modest growth in spending and production. Job gains have been robust in recent months, and the unemployment rate has remained low. Inflation remains elevated, reflecting supply and demand imbalances related to the pandemic, higher food and energy prices, and broader price pressures.
Russia’s war against Ukraine is causing tremendous human and economic hardship. The war and related events are contributing to upward pressure on inflation and are weighing on global economic activity. The Committee is highly attentive to inflation risks.”
This seventh rate hike this year – and the second one in the 4th quarter – were some of the more predicted rate movement the markets have ever seen.
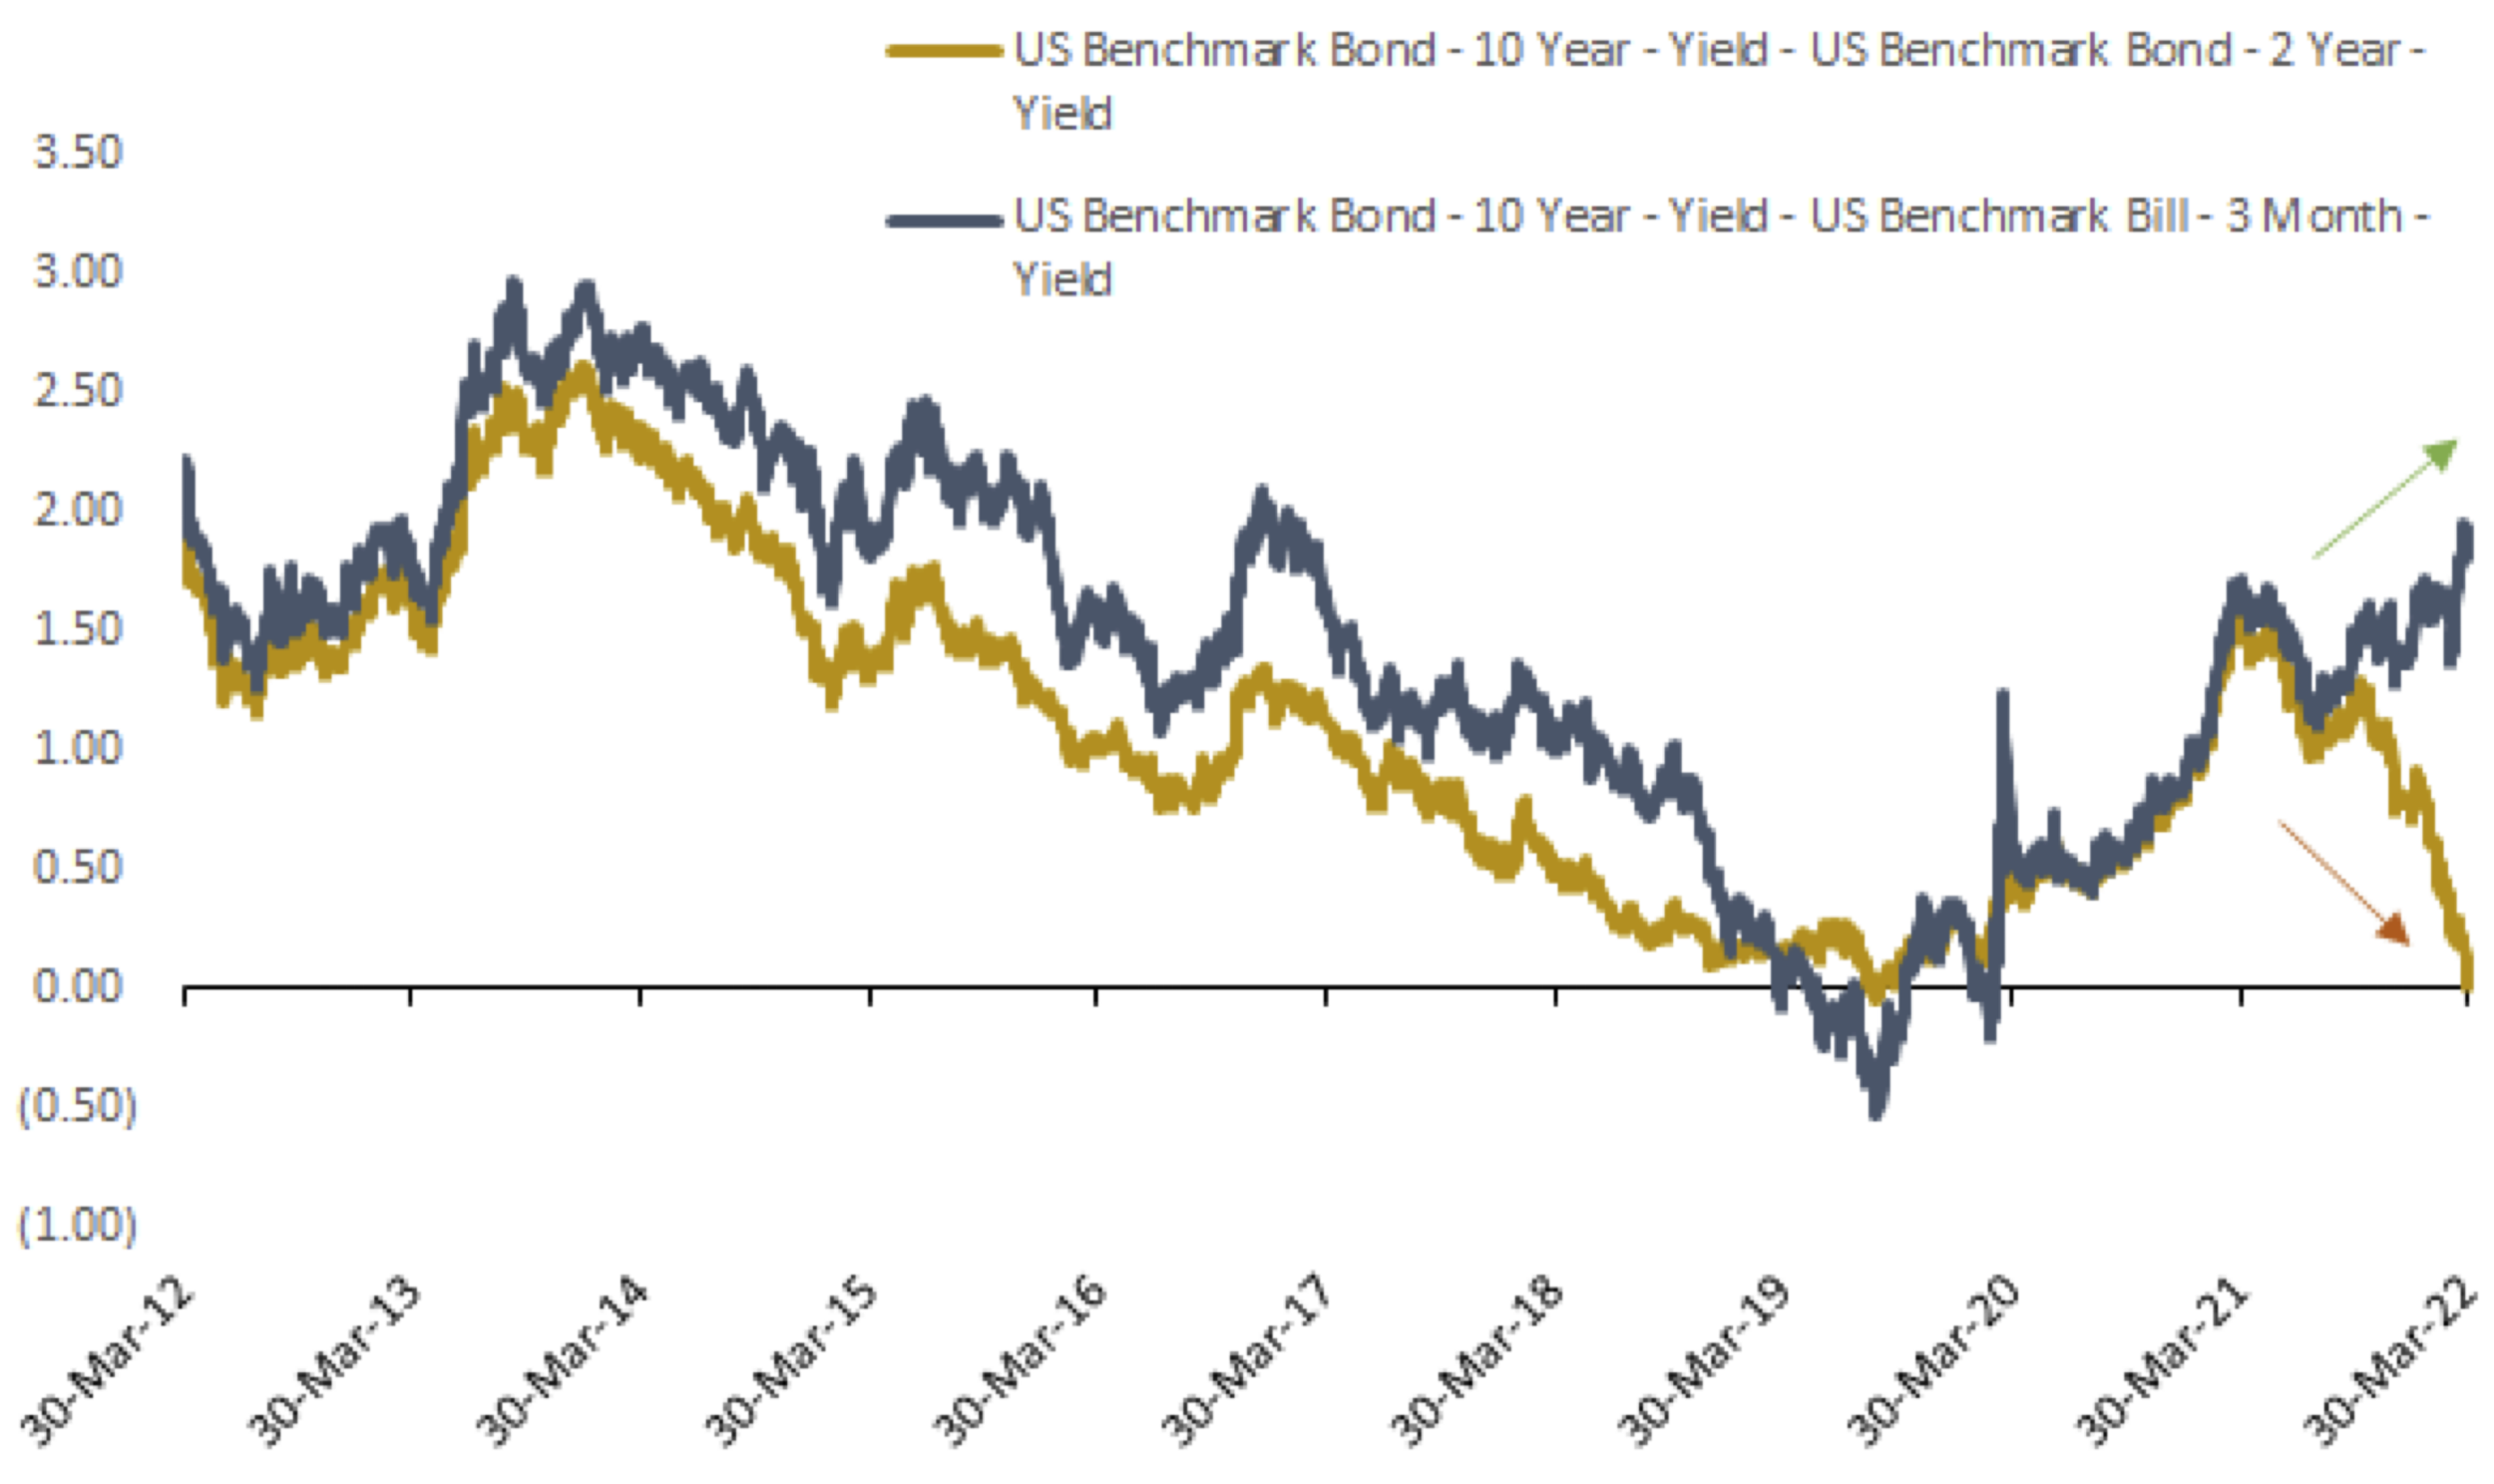
Fed Rate Hikes: Taming Inflation
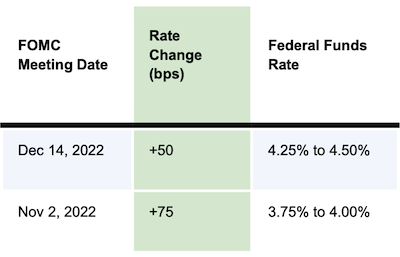
In addition, Wall Street is expecting the federal funds rate to move above 5% in 2023.

Inflation Still Stubbornly High
The Bureau of Labor Statistics announced the Consumer Price Index for All Urban Consumers (CPI- U) rose 0.1% in November on a seasonally adjusted basis, after increasing 0.4% in October.
In addition, over the last 12 months, the all items index increased 7.1% before seasonal adjustment.
With core prices – excluding the volatile food and energy costs – inflation was up 6.0%. Economists surveyed by the Wall Street Journal had expected an increase of 7.3% for headline CPI and 6.1% for core inflation.
12-month percentage change, Consumer Price Index, selected categories, November 2022, not seasonally adjusted.

Source: U.S. Bureau of Labor Statistics.
Further:
The index for shelter was by far the largest contributor to the monthly all items increase, more than offsetting decreases in energy indexes.
The food index increased 0.5% over the month with the food at home index also rising 0.5%.
The energy index decreased 1.6% over the month as the gasoline index, the natural gas index, and the electricity index all declined.
The index for all items less food and energy rose 0.2% in November, after rising 0.3% in October.
The indexes for shelter, communication, recreation, motor vehicle insurance, education, and apparel were among those that increased over the month.
Indexes which declined in November include the used cars and trucks, medical care, and airline fares indexes.
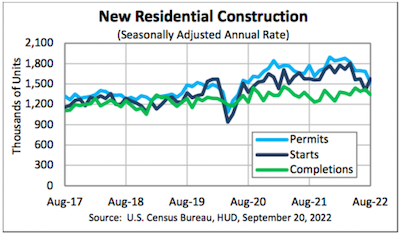
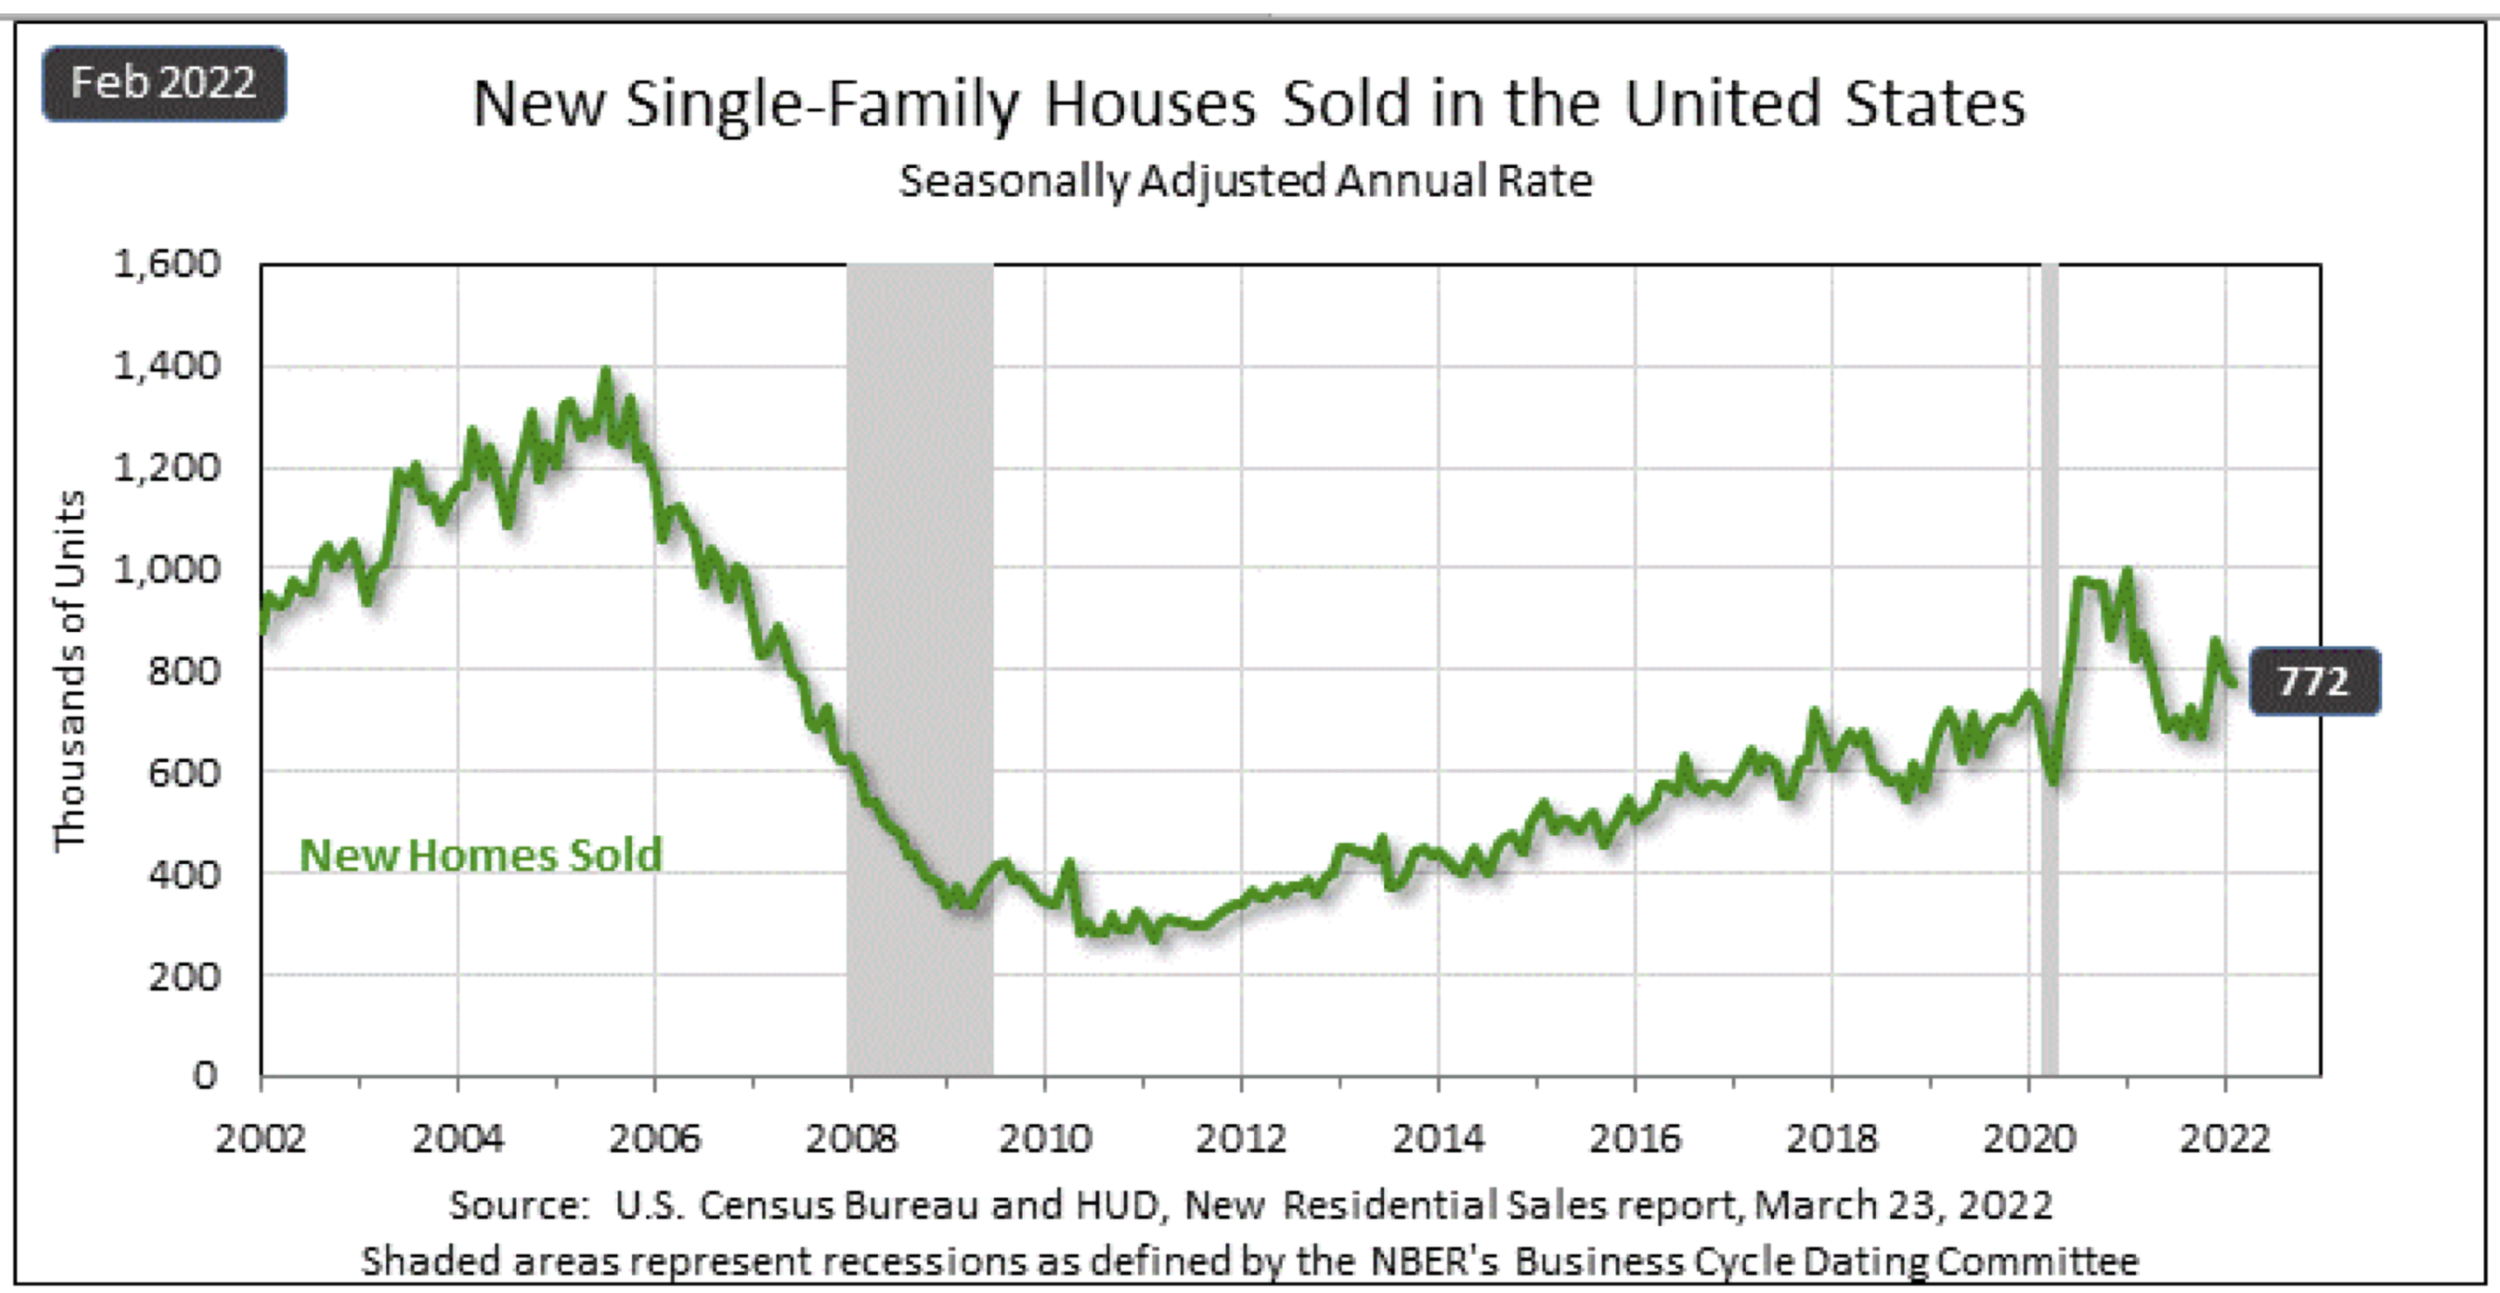
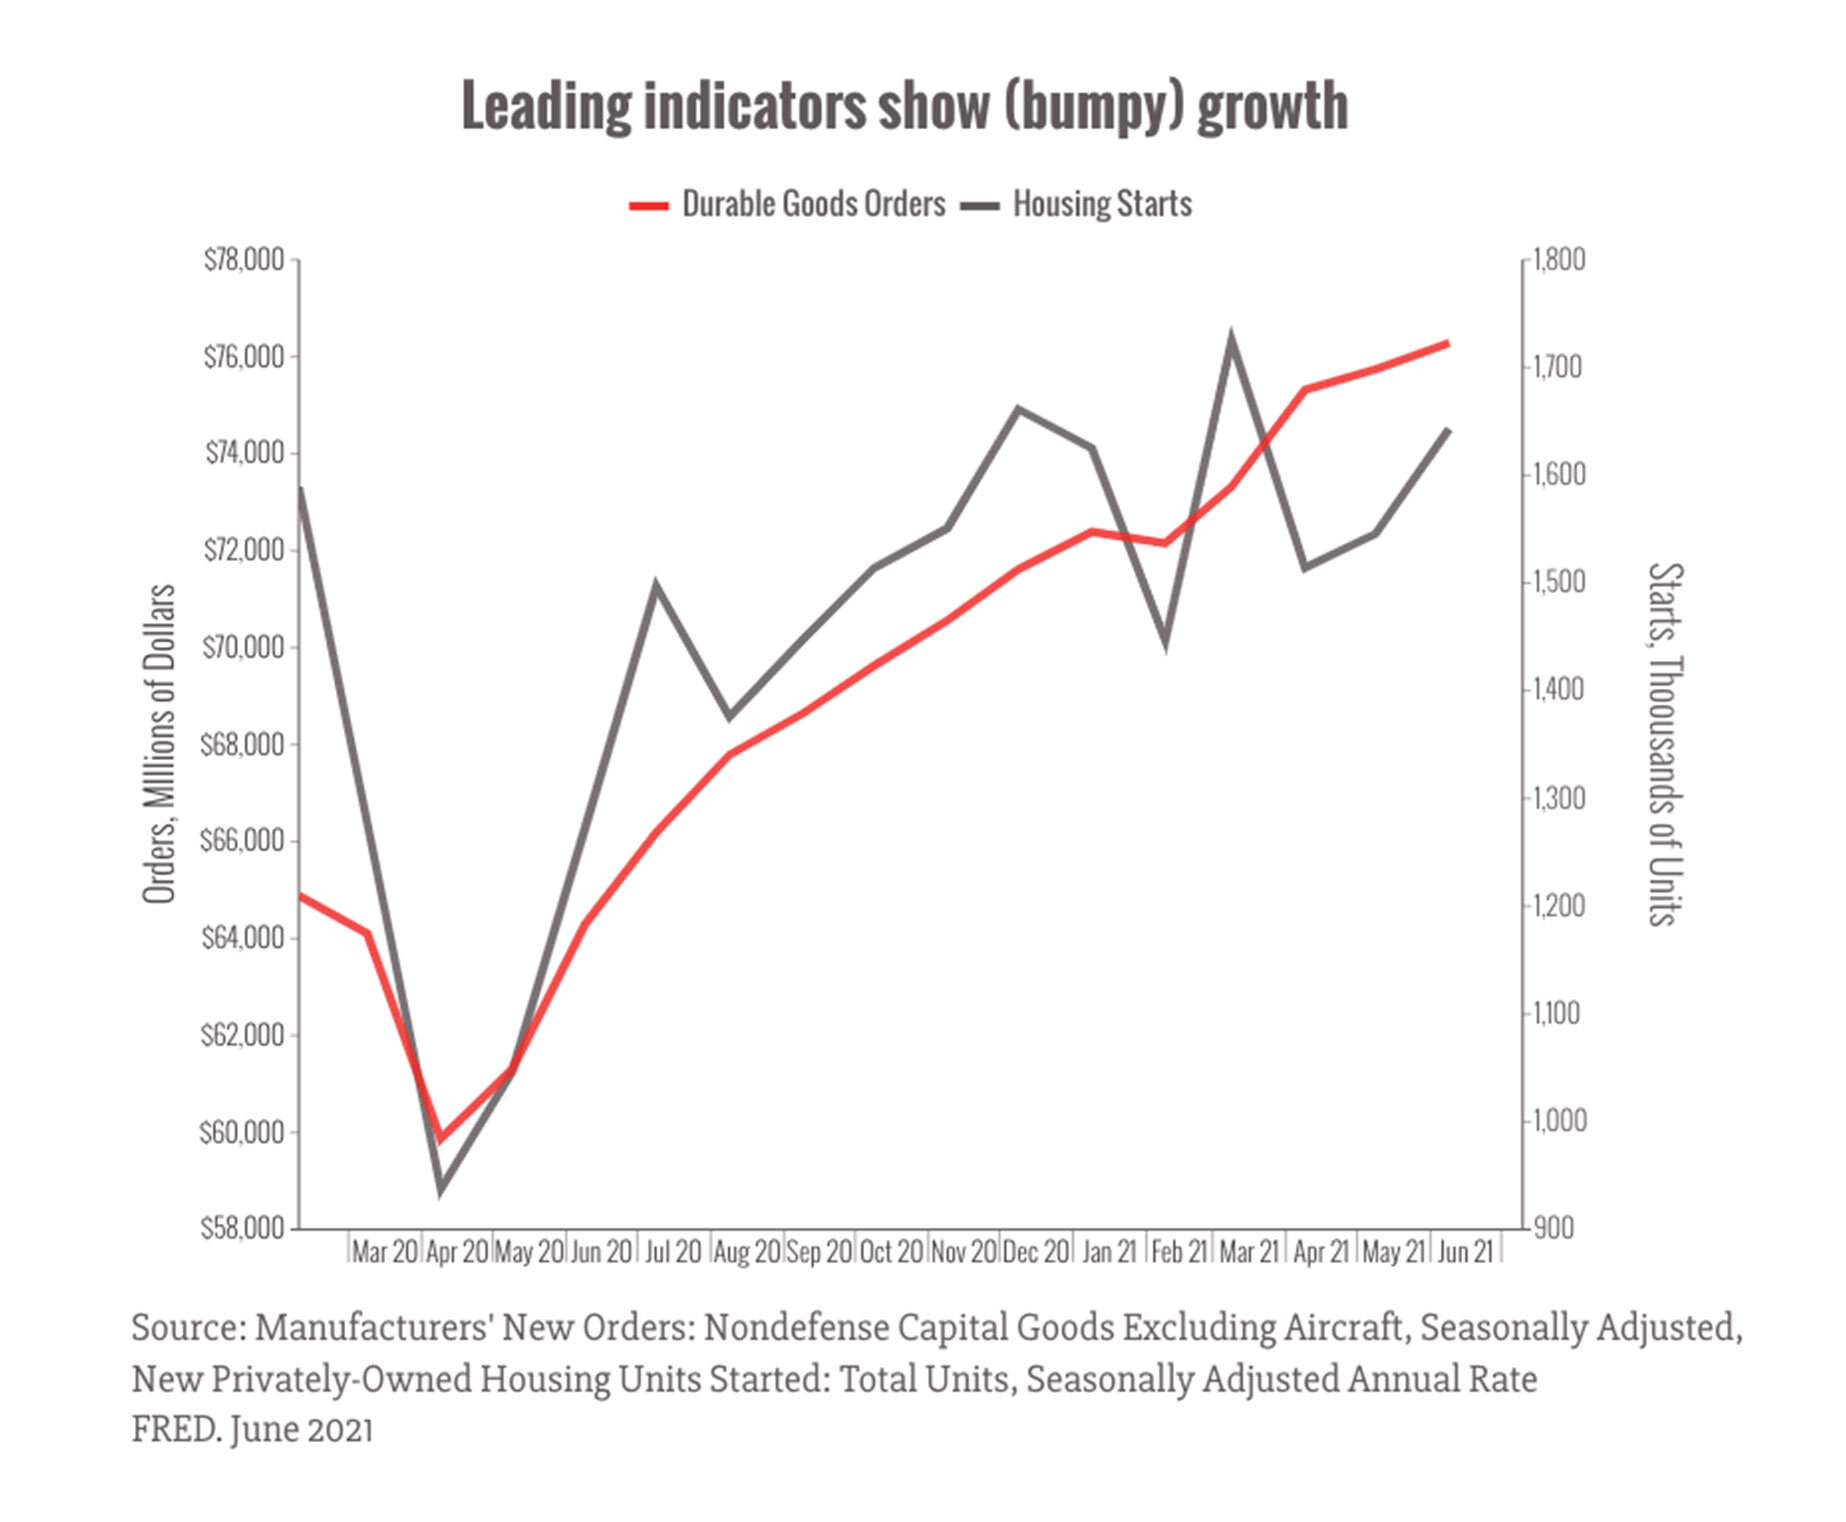
Cooling Off Housing Market
The U.S. Census Bureau and the U.S. Department of Housing and Urban Development jointly announced the following new residential construction statistics for November 2022:
Sales of new single‐family houses in November 2022 were at a seasonally adjusted annual rate of 640,000
This is 5.8% above the revised October rate of 605,000, but is 15.3% below the November 2021 estimate of 756,000
The median sales price of new houses sold in November 2022 was $471,200
The average sales price was $543,600
The seasonally‐adjusted estimate of new houses for sale at the end of November was 461,000. This represents a supply of 8.6 months at the current sales rate.

Consumer Confidence Jumps
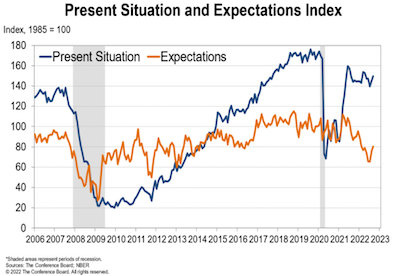
“The Conference Board Consumer Confidence Index increased in December following back-to-back monthly declines. The Index now stands at 108.3 (1985=100), up sharply from 101.4 in November.
The Present Situation Index—based on consumers’ assessment of current business and labor market conditions – increased to 147.2 from 138.3 last month.
The Expectations Index – based on consumers’ short-term outlook for income, business, and labor market conditions – improved to 82.4 from 76.7. However, Expectations are still lingering around 80 – a level associated with recession.
“Consumer confidence bounced back in December, reversing consecutive declines in October and November to reach its highest level since April 2022. The Present Situation and Expectations Indexes improved due to consumers’ more favorable view regarding the economy and jobs. Inflation expectations retreated in December to their lowest level since September 2021, with recent declines in gas prices a major impetus. Vacation intentions improved but plans to purchase homes and big-ticket appliances cooled further. This shift in consumers’ preference from big-ticket items to services will continue in 2023, as will headwinds from inflation and interest rate hikes.”

Present Situation
Consumers’ assessment of current business conditions improved in December.
19.0% of consumers said business conditions were “good,” up from 17.8%.
20.1% said business conditions were “bad,” down from 23.6%.
Consumers’ appraisal of the labor market was also more favorable.
47.8% of consumers said jobs were “plentiful,” up from 45.2%.
12.0% of consumers said jobs were “hard to get,” down from 13.7%.

Expectations Six Months Hence
Consumers were less pessimistic about the short-term business conditions outlook in December.
20.4% of consumers expect business conditions to improve, up from 19.8%.
20.3% expect business conditions to worsen, down from 21.0%.
Consumers were more upbeat about the short-term labor market outlook.
19.5% of consumers expect more jobs to be available, up from 18.5%.
18.3% anticipate fewer jobs, down from 21.2%.
Consumers were mixed about their short- term income prospects.
16.7% of consumers expect their incomes to increase, down slightly from 17.1%.
However, 13.3% expect their incomes will decrease, down from 15.8%.
Retail Sales Down
The U.S. Census Bureau announced that U.S. retail and food services sales for November 2022, were $689.4 billion, down 0.6% from the previous month, but up 6.5% above November 2021.

Total sales for the September 2022 through November 2022 period were up 7.7% from the same period a year ago.
Retail trade sales were down 0.8% from October 2022, but up 5.4% above last year.
Gasoline stations were up 16.2% from November 2021, while food services and drinking places were up 14.1% from last year
Monthly Retail Sales: Past 20 Years

Consumer Sentiment Jumps
The University of Michigan released its index of Consumer Sentiment and reported that “consumer sentiment confirmed the preliminary reading earlier this month, rising 5% above November. Sentiment remains relatively downbeat at 15% below a year ago, but consumers’ extremely negative attitudes have softened this month on the basis of easing pressures from inflation. One-year business conditions surged 25%, and the long-term outlook improved a more modest but still sizable 9%. Still, both measures are well below 2021 readings. Assessments of personal finances, both current and future, are essentially unchanged from November.
Year-ahead inflation expectations improved considerably but remained elevated, falling from 4.9% in November to 4.4% in December, the lowest reading in 18 months but still well above two years ago. Declines in short-run inflation expectations were visible across the distribution of age, income, education, as well as political party identification. At 2.9%, long run inflation expectations have stayed within the narrow, albeit elevated, 2.9-3.1% range for 16 of the last 17 months. While the sizable decline in short-run inflation expectations may be welcome news, consumers continued to exhibit substantial uncertainty over the future path of prices.”
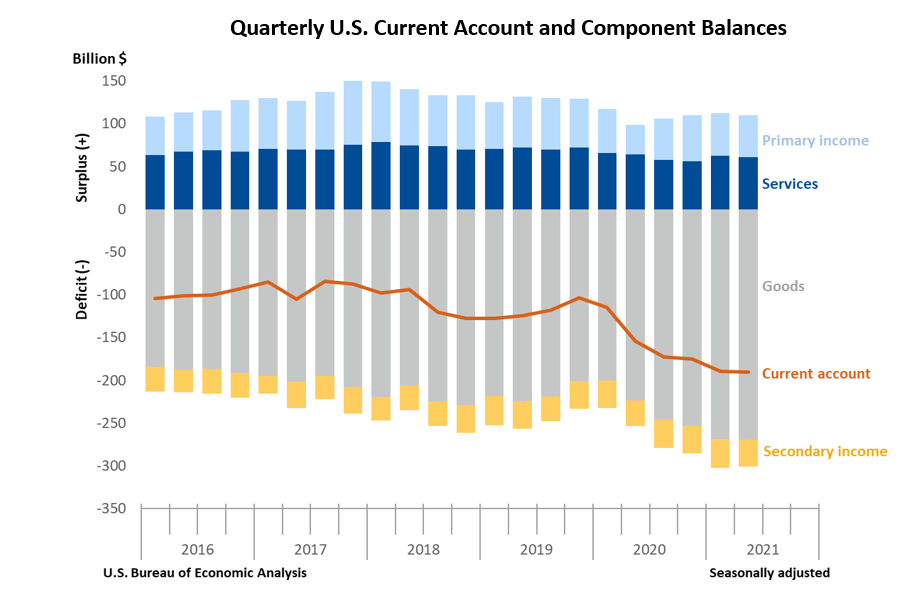
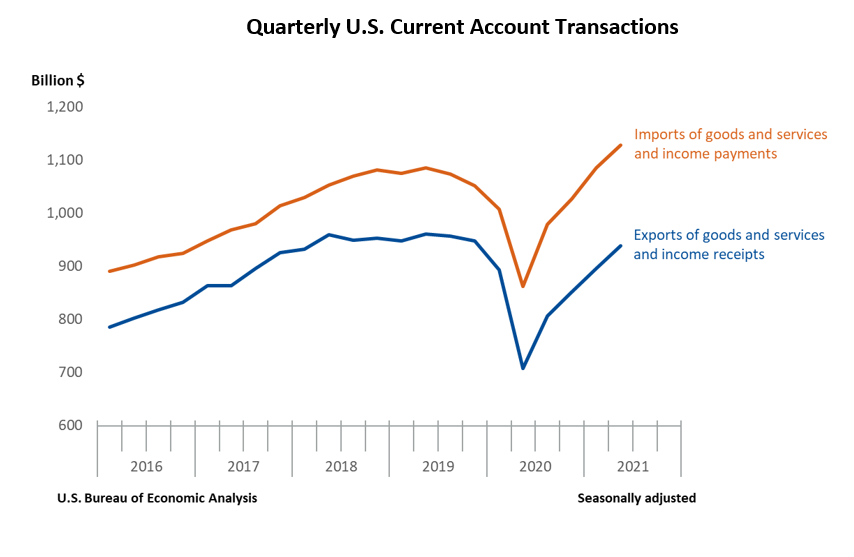
Exports and Imports Down
The U.S. Census Bureau announced the following international trade, wholesale inventories, and retail inventories advance statistics for November 2022:
Advance International Trade in Goods
The international trade deficit was $83.3 billion in November, down $15.5 billion from $98.8 billion in October.
Exports of goods for November were $168.9 billion, $5.3 billion less than October exports.
Imports of goods for November were $252.2 billion, $20.8 billion less than October imports.
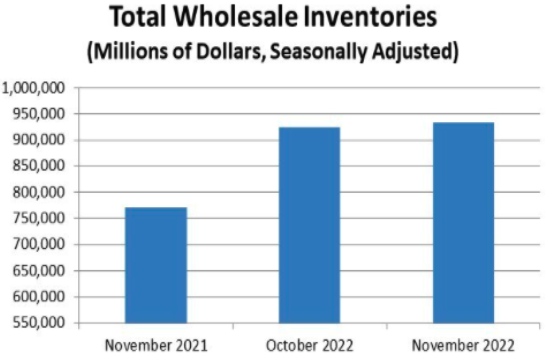
Advance Wholesale Inventories
Wholesale inventories for November, adjusted for seasonal variations and trading day differences, but not for price changes, were estimated at an end-of-month level of $933.6 billion, up 1.0% from October 2022.
This is up 21.0% from November 2021.
The September 2022 to October 2022 percentage change was revised from up 0.5% to up 0.6%.
Advance Retail Inventories
Retail inventories for November, adjusted for seasonal variations and trading day differences, but not for price changes, were estimated at an end-of-month level of $738.7 billion, up 0.1% from October 2022.
This is up 18.4% from November 2021.
The September 2022 to October 2022 percentage change was revised from down 0.2% to down 0.4%.

Sources: bls.gov; bea.gov; census.gov; umich.edu; conference- board.org; census.gov; msci.com; fidelity.com; msci.com; nasdaq.com; wsj.com; morningstar.com
Partnering with Outside The Box Financial Planning offers numerous benefits for individuals seeking retirement planning, small business support, wealth management, and beyond. With their fiduciary duty, comprehensive approach, unbiased advice, transparent fee structure, and ongoing support, OTBFP act as a trusted advisor who prioritizes your best interests. Click here to schedule a complimentary “Fit” meeting to determine if we would make a good mutual fit.
Remember, financial decisions have long-lasting implications, and working with a professional can provide the expertise and guidance necessary to make informed choices that align with your financial aspirations.
However, if you would like to take a shot at building a financial plan on your own, we offer our financial planning software, RightCapital, free of charge. Click here to get started.