The Fed Makes The Biggest Rate Hike in 28 Years

From the Federal Reserve press release dated June 15, 2022:

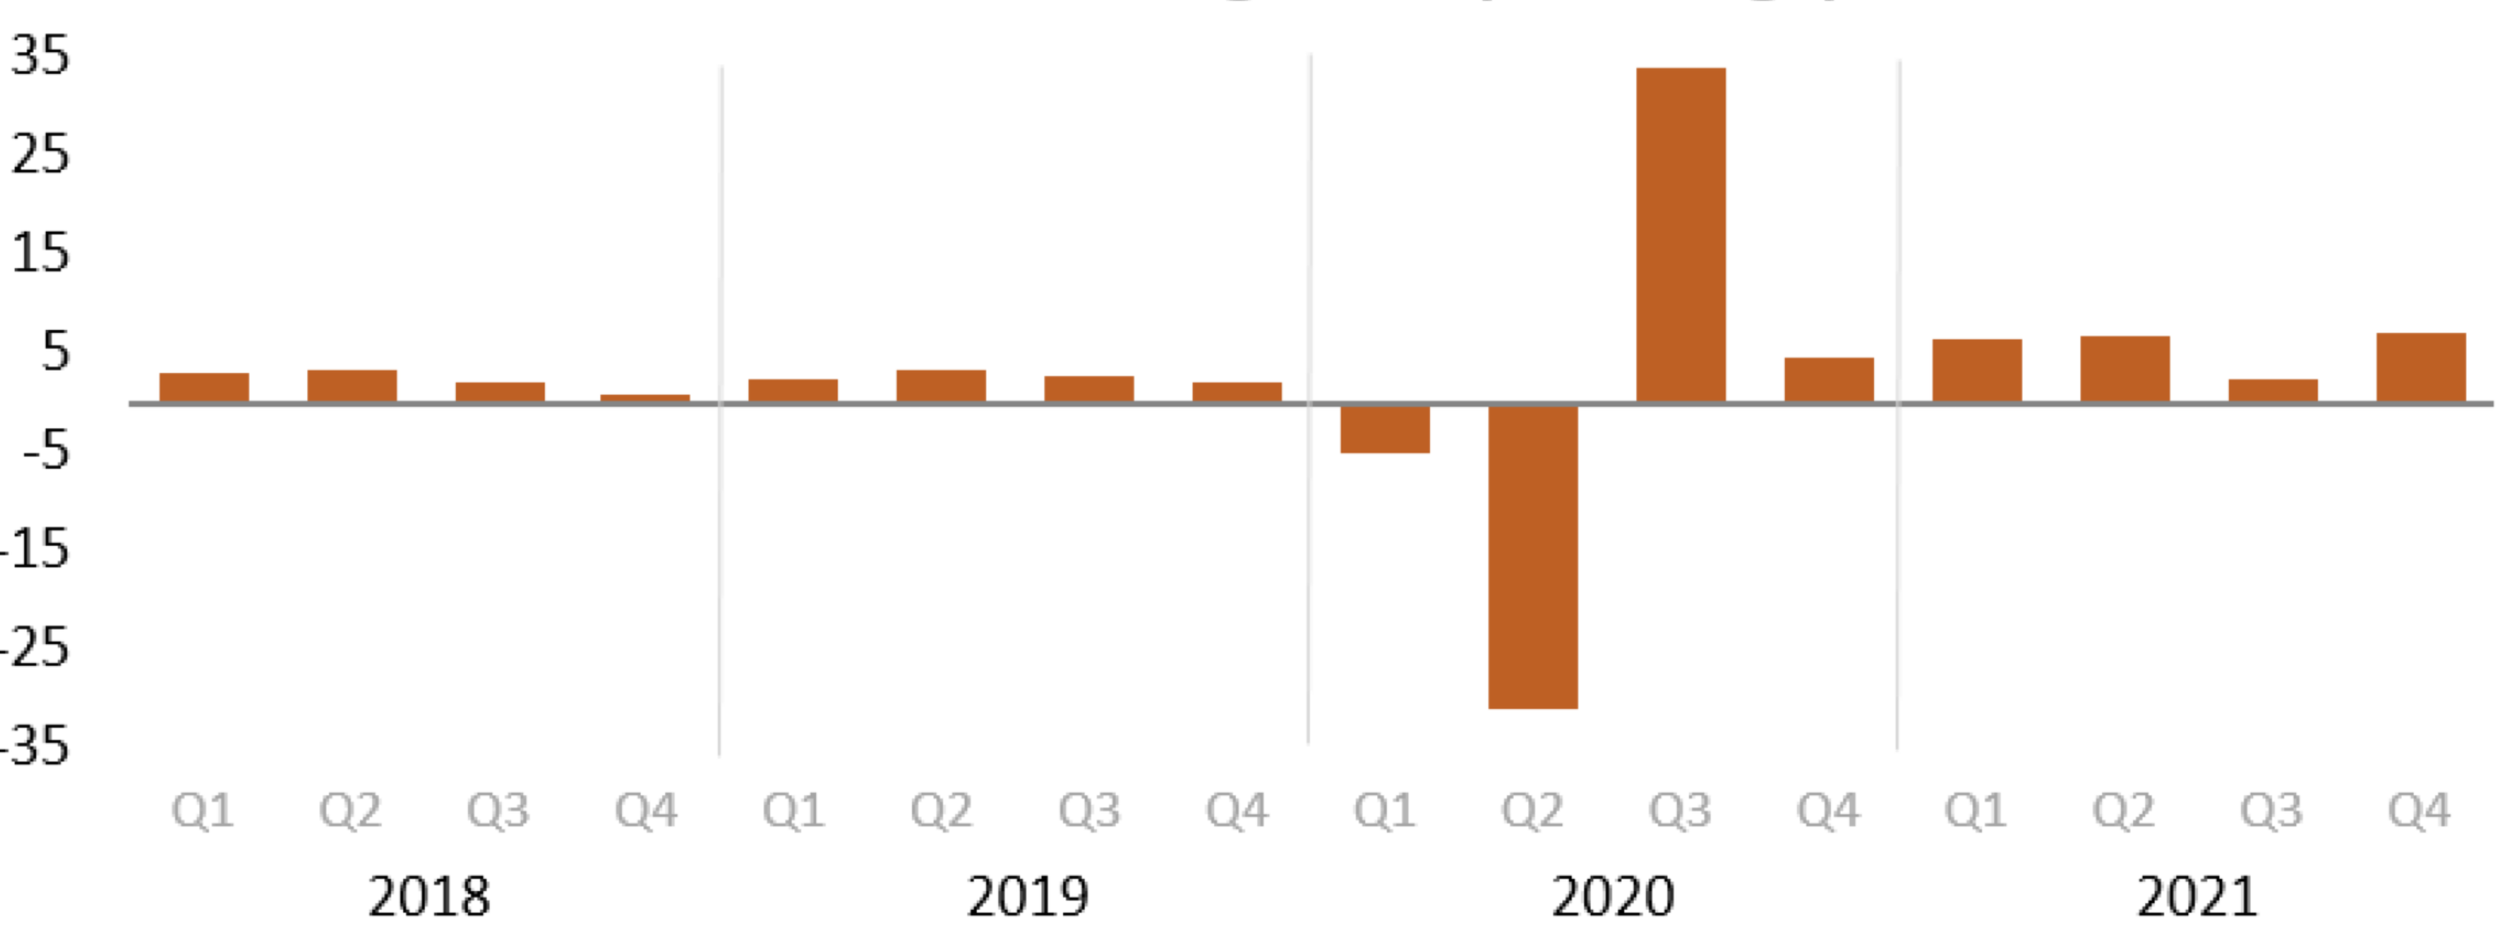
“Overall economic activity appears to have picked up after edging down in the first quarter. Job gains have been robust in recent months, and the unemployment rate has remained low. Inflation remains elevated, reflecting supply and demand imbalances related to the pandemic, higher energy prices, and broader price pressures.

The invasion of Ukraine by Russia is causing tremendous human and economic hardship. The invasion and related events are creating additional upward pressure on inflation and are weighing on global economic activity. In addition, COVID-related lockdowns in China are likely to exacerbate supply chain disruptions. The Committee is highly attentive to inflation risks.

The Committee seeks to achieve maximum employment and inflation at the rate of 2 percent over the longer run. In support of these goals, the Committee decided to raise the target range for the federal funds rate to 1-1/2 to 1-3/4 percent and anticipates that ongoing increases in the target range will be appropriate. In addition, the Committee will continue reducing its holdings of Treasury securities and agency debt and agency mortgage-backed securities, as described in the Plans for Reducing the Size of the Federal Reserve's Balance Sheet that were issued in May. The Committee is strongly committed to returning inflation to its 2 percent objective.”

No One Was Surprised

This rate hike –like the previous hike earlier this year–was one of the most predictable and predicted rate movements the markets have ever seen. What was not predicted until recently, however, was the magnitude of the rate hike. Yet while the markets and traders were expecting this hike, the announcement did contribute to the DJIA, NASDAQ, and the S&P 500 all rallying by more than 1%. But within a few hours after markets closed, the futures market suggested that those gains would be wiped out the following day.

Keep in mind that’s only one trading day and one futures “night”–long-term investors should think about the risk that the Fed continues moving rates higher and faster than expected throughout 2022 because then we could see some longer-term challenges for the stock market and consumers. And higher rates are all but certain to happen for the remainder of the year. The magnitude, however, depends on a number of factors. “Clearly, today’s 75 basis point increase is an unusually large one, and I do not expect moves of this size to be common,” said Fed Chair Jerome Powell. And Powell also said that decisions will be made “meeting by meeting.”

Interestingly, as of the day after the Fed’s historic announcement, Wall Street assigned a probability of more than 80% that the Fed would raise rates by another 75 basis points at their next meeting at the end of July. So, will there be implications for this announcement? Sure. But enough to make most investors change allocations or courses of action? Maybe. Maybe not.

Reason to Change

The most important tool available to the Fed is its ability to set the federal funds rate, or the prime interest rate. This is the interest paid by banks to borrow money from the Federal Reserve Bank. Interest is, basically, the cost to the banks of borrowing someone else’s money. The banks will pass on this cost to their own borrowers.

Increasing the federal funds rate reduces the supply of money by making it more expensive to obtain. Reducing the amount of money in circulation, by decreasing consumer and business spending, helps to reduce inflation.

Effects on Consumers and Businesses

Any increased expense for banks to borrow money has a ripple effect, which influences both individuals and businesses in their costs and plans.

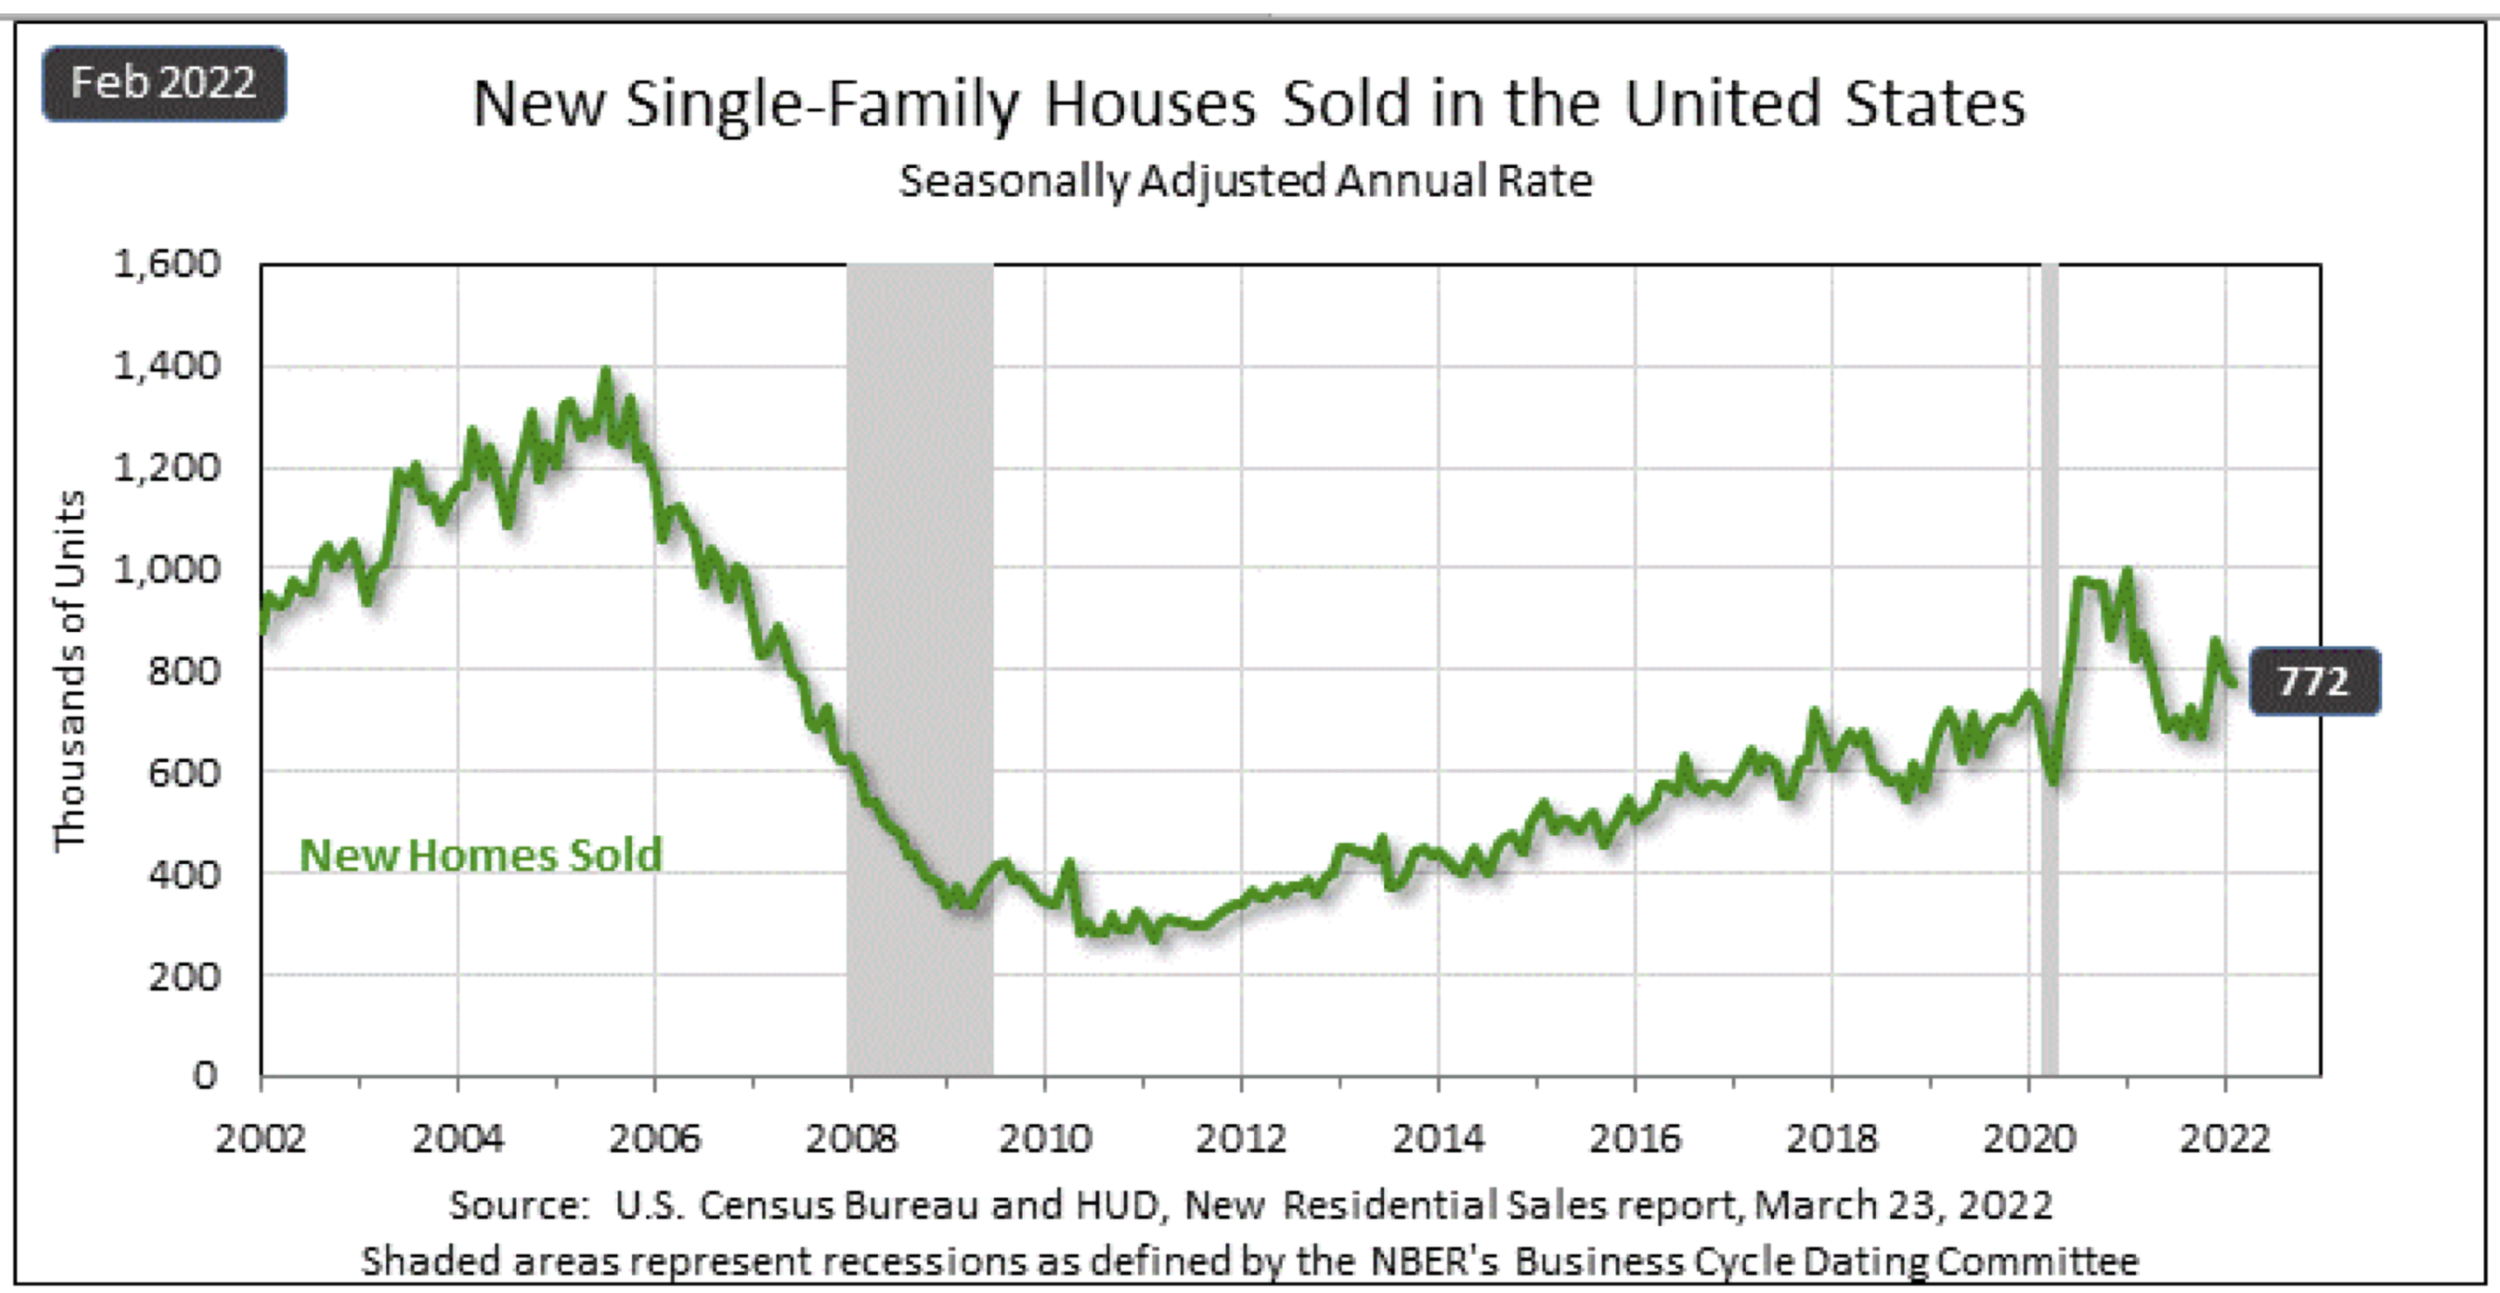
  • Banks increase the rates that they charge to individuals to borrow money, through increases in credit card and mortgage interest rates. As a result, consumers have less money to spend and must face the effect of what they want to purchase and when to do so. In other words, mortgage rates are trending up and credit card interest rates are too. The same is true with auto loans.

  • Because consumers will have less disposable income (in theory), businesses must consider the effects on their revenues and profits. Businesses also face the effect of the greater expenses of borrowing money. As the banks make borrowing more expensive for businesses, companies are likely to reduce their spending. Less business spending and capital investment can slow the growth of the economy, decreasing business profits.

These broad interactions can play out in numerous ways.

Effects on the Markets

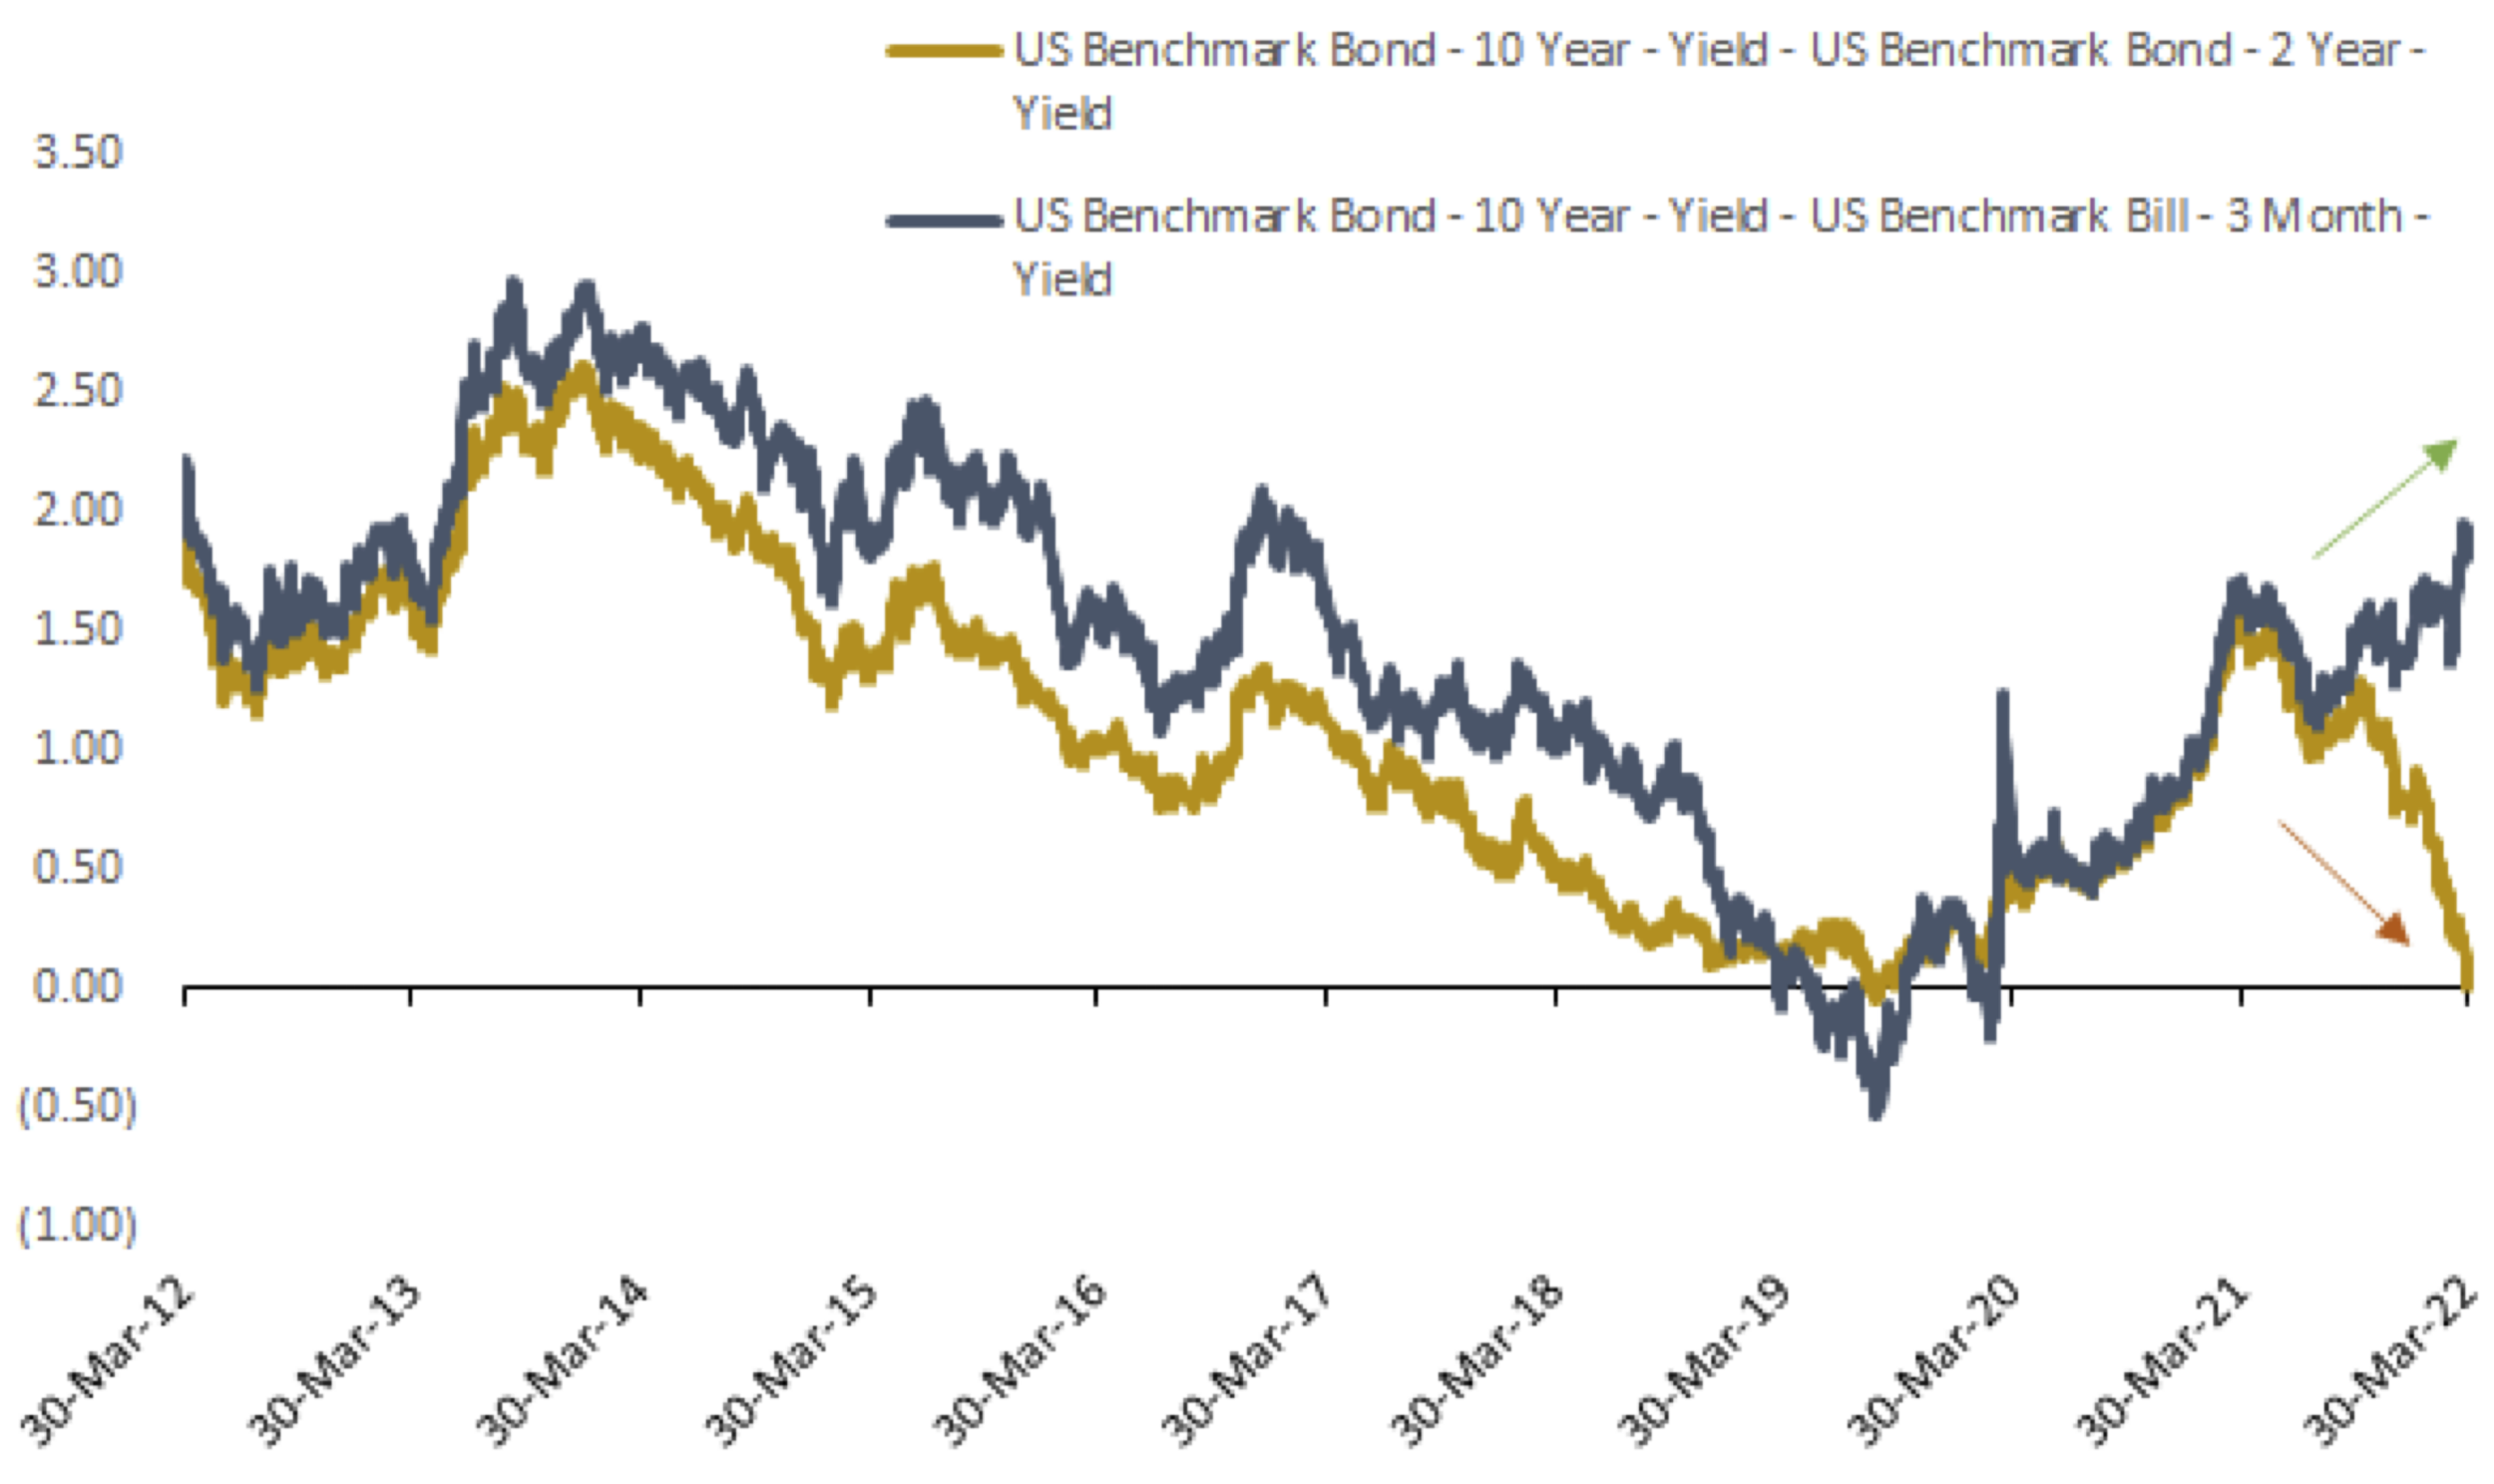
This one is a bit trickier because intuitively stock prices should decrease when investors see companies reduce growth spending or make less profit. The reality, however, is that the Fed typically won’t raise rates unless they deem the economy healthy enough to withstand what should –at least in textbooks –slow the economy. But the reality is that stocks often do well in the year following an initial rate hike. But after multiple and large rate hikes in the same year? Much tougher to predict. If the stock market declines, investors tend to view the risk of stock investments as outweighing the rewards and they will often move toward the safer bonds and Treasury bills. As a result, bond interest rates will rise, and investors will likely earn more from bonds. Obviously, many factors affect activity in various parts of the economy. A change in interest rates, although important, is just one of those factors. Give me a call if you have questions or want to discuss additional repercussions that this Fedrate increase will likely have. ways.

Ivan Havrylyan
Q1 2022 Market Commentary

Global Market Commentary: First Quarter 2022

Markets Have Worst Quarter Since 1Q2020

Global equity markets had a volatile first quarter and when the final Wall Street bell rang on March 31st, global equity markets were in the red, as March was not enough to make up for the dismal returns from January and February.

But maybe the worst news was that the bond market suffered its worst quarter since 1980.

For the first quarter of 2022:

  • The DJIA ended Q1 with a loss of 5.2%;

  • The S&P 500 ended Q1 with a loss of 5.5%;

  • NASDAQ ended Q1 with a loss of 10.2%; and

  • The Russell 2000 ended Q1 with a loss of 8.9%.

The themes that drove market performance in the first quarter were the same themes that drove markets toward the end of last year. But in late February and throughout all of March, Wall Street dealt with the invasion of Ukraine by Russia and its impact on global markets.

Volatility and oil prices spiked this quarter, driven by a host of issues, including Russia’s invasion, rising inflation, supply chain issues and the Federal Reserve’s timing and size of rate hikes (we saw a 25 basis point hike in March).

The other themes were volatile consumer confidence, continued red-hot housing prices, high GDP growth numbers and corporate earnings that came in better than expected.

Further, we saw that:

  • Volatility, as measured by the VIX, trended up most of the month, more than doubling to a high of 36 on March 7th, before retreating to come to rest marginally higher than where it began the month.

  • West Texas Intermediate crude made a big move in the first quarter, starting at $75/barrel and ending the quarter at over $100. For perspective, WTI started 2021 at $48/barrel.

Market Performance Around the World

Investors were unhappy with the quarterly performance around the world, as 35 of the 36 developed markets tracked by MSCI were negative for the first quarter of 2022, with only MSCI Pacific ex-Japan advancing. And for the 40 developing markets tracked by MSCI, 26 of them were negative, with many posting staggering losses, including MSCI Eastern Europe that dropped almost 60%.

Source: MSCI. Past performance cannot guarantee future results

March Could Not Lift the Entire Quarter

U.S. equity markets reversed the negative course of the quarter’s first two months and ended March in positive territory. But it was still not enough to overcome the biggest two-month drop (January and February) since March 2020 as markets ended the 1st quarter of 2022 in the red - the first since the 1st quarter of 2020.

For the month of March:

  • The DJIA was up 4.2%;

  • The S&P 500 was up 5.2%;

  • NASDAQ was up 5.1%; and

  • The Russell 2000 was up 3.1%.

Sector Performance Rotated in Q12022

The overall trend for sector performance for all 3 months so far in 2022 was mixed and the performance leaders and laggards rotated throughout, giving investors a few mini sector rotations each month and during the quarter.

Here are the sector returns for the shorter time periods:

Source: FMR

Reviewing the sector returns for just the first quarter of 2022, we saw that:

  • 9 of the 11 sectors were painted red for the first quarter, which is in stark comparison to the previous quarter;

  • The Energy sector turned in an astonishing quarter, driven by a massive jump in oil prices;

  • The defensive Utilities sector turned in a good quarter;

  • The interest-rate sensitive sectors (Information Technology and Financials specifically) struggled as the Fed raised rates by 25 bps; and

  • The differences between the best (+38%) performing and worst (-13%) performing sectors in the first quarter widened.

The Fed Increases Rates

The dominant theme this month (besides Russia/Ukraine) revolved around whether the Fed might need to raise short-term interest rates more quickly and more often, eating into future profits, especially within the high-flying tech names.

Then at the March meeting, the Federal Reserve moved its fed funds target rate from near zero to a range of 0.25% to 0.50%. It was the first rate hike since 2018.

The Federal Funds Rate – 10 Year Chart

But the Fed also released the so-called “dot plot,” which shows where individual Fed officials expect interest rates to be.

And given the surge in inflation numbers – from the perspectives of both consumers (CPI) and producers (PPI), the majority now expect seven hikes in 2022, four in 2023 and none for 2024. (In other words, there could be a rate hike at every remaining Fed meeting this year and at half the meetings next year.)

If this comes true, it would be higher than the Fed’s estimate of the long-run neutral rate, (which is 2%), and would suggest a more hawkish policy that could be more restrictive to growth.

Interestingly enough, when the Fed raised rates 25 basis points and released its “dot plot,” stocks rallied, suggesting that Wall Street appreciates the path that has been outlined.

But The Fed Was Not Unanimous

By its own metrics, however, it was becoming increasingly difficult for the Fed to forestall a rate increase at least in the range of 0.25%.

In fact, buried in a footnote of the Fed’s statement was this nugget:

“Voting against this action was James Bullard, who preferred at this meeting to raise the target range for the federal funds rate by 0.5 percentage points to 1/2 to 3/4 percent.”

Bond Markets Struggle

At the end of the quarter, there was a lot of chatter because the 2-year Treasury yield and the 10-year Treasury yield inverted, leading many to suggest a recession is on the way in the next 12 months.

10YR-2YR Treasury curve and 10YR-3MTH Treasury curve (%)

But lost in much of the quarter-end summaries was this ominous sign: the bond market suffered its worst quarter since 1980. Specifically, the Bloomberg U.S. Aggregate Bond Index had its worst quarter since late 1980.

Want more bad bond news? Well,

  • The first quarter of 2022 was the third-worst quarter since the index’s inception.

  • March was the worst monthly performance for the index since July 2003.

GDP UP 6.9% Last Quarter

Two days before the quarter ended, the Bureau of Economic Analysis reported that real gross domestic product increased at an annual rate of 6.9% in the fourth quarter of 2021.

In the third quarter, real GDP increased 2.3 percent.

U.S. Bureau of Economic Analysis. Seasonally adjusted at annual rates.

PCE Price Index Up 6.4% Over 12 Months

The Bureau of Economic Analysis reported a lot of information on the last day of the quarter, including that:

  • Personal income increased $101.5 billion (0.5%) in February

  • Disposable personal income increased by $76.1 billion (0.4%)

  • Personal consumption expenditures increased $34.9 billion (0.2%)

Further:

  • Real DPI decreased 0.2% in February and Real PCE decreased 0.4%

  • Goods decreased 2.1%

  • Services increased 0.6%

  • The PCE price index increased 0.6%

  • Excluding food and energy, the PCE price index increased 0.4%

The PCE price index for February increased 6.4% from one year ago, reflecting increases in both goods and services.

  • Energy prices increased 25.7%

  • Food prices increased 8.0%

  • Excluding food and energy, the PCE price index for February increased 5.4% from one year ago

Personal Consumption Expenditures Price Index, Ex-Food and Energy

Change from Month One Year Ago

February 2022 5.4%

January 2022 5.2%

December 2021 4.9%

November 2021 4.7%

Unemployment is Very Low

Unemployment (3.8%) is now nearly at record lows. In addition, the number of job openings exceeds the number of unemployed by the widest margin in the past 20 years.

Record job openings exceed the number of unemployed (numbers in millions)

Source: FactSet

This paradigm suggests that we will be in a tight labor market for a while. And the jobs growth and unemployment numbers reported at the end of the quarter reinforce that notion.

Source: Bureau of Labor Statistics

New Home Sales Down

The U.S. Census Bureau and the U.S. Department of Housing and Urban Development jointly announced the following new residential sales statistics for February 2022.

New Home Sales

  • Sales of new single‐family houses in February 2022 were at a seasonally adjusted annual rate of 772,000

  • This is 2.0% below the January rate of 788,000

  • This is 6.2% below the February 2021 estimate of 823,000

Sales Price, Inventory, and Months’ Supply

  • The median sales price of new houses sold in February 2022 was $400,600

  • The average sales price was $511,000

  • The seasonally‐adjusted estimate of new houses for sale at the end of February was 407,000

  • This represents a supply of 6.3 months at the current sales rate

Consumer Confidence is Up

The Conference Board announced that “the Consumer Confidence Index increased slightly in March, after a decrease in February. The Index now stands at 107.2 (1985=100), up from 105.7 in February. The Present Situation Index – based on consumers’ assessment of current business and labor market conditions—improved to 153.0 from 143.0 last month. However, the Expectations Index – based on consumers’ short-term outlook for income, business, and labor market conditions— declined to 76.6 from 80.8.”

Present Situation
Consumers’ appraisal of current business conditions improved in March.

  • 19.6% of consumers said business conditions

    were “good,” up from 17.6%.

  • 22.1% of consumers said business conditions were “bad,” down from 25.1%.

Consumers’ assessment of the labor market also improved.

  • 57.2% of consumers said jobs were “plentiful,” up from 53.5%, a new historical high.

  • 9.8% of consumers said jobs are “hard to get,” down from 12.0%.

Expectations Six Months Hence

Consumers’ optimism about the short-term business conditions outlook declined in March.

  • 18.7% of consumers expect business conditions will improve, down from 21.3%.

  • 23.8% expect business conditions to worsen, up from 19.9%.

Consumers were mixed about the short-term labor market outlook.

  • 17.4% of consumers expect more jobs to be available in the months ahead, down from 19.4%.

  • Conversely, 17.7% anticipate fewer jobs, down from 19.6%.

Consumers were also mixed about their short-term financial prospects.

  • 14.9% of consumers expect their incomes to increase, up from 14.7%.

  • 13.7% expect their incomes will decrease, up from 13.0%.

Sources: conference-board.org; bea.gov; census.gov; msci.com; fidelity.com; nasdaq.com; wsj.com; morningstar.com; bea.gov

Financial Moves to Consider Before 2022 and Knowing Next Year's New IRS Contribution Limits

The year-end holidays approach and bring lots of things to do. Yet with holiday cheer there are financial plans to make, too.

Consider these financial opportunities before 2022 arrives.

MAKE FINANCIAL GIFTS

As we count our many blessings and share time with our loved ones, we can express our thanks through giving to others. Donate to your favorite charity before year-end.

Generally speaking, the amount of charitable cash contributions taxpayers can deduct on Schedule A as an itemized deduction is limited to a percentage (usually 60%) of the taxpayer's adjusted gross income. But did you know that the IRS has temporarily suspended limits on charitable contributions?

Sure it might change, but as of now, qualified contributions are not subject to this limitation and individuals may deduct qualified contributions of up to 100% of their adjusted gross income.

To qualify, the contribution must be a cash contribution and made to a qualifying organization. Contributions of non–cash property do not qualify for this relief. Taxpayers may still claim non–cash contributions as a deduction, subject to the normal limits.

You can gift assets or cash to your child, any relative, or even a friend, and take advantage of the annual gift tax exclusion. Any individual can gift up to $15,000 this year to as many other individuals as he or she desires a couple may jointly gift up to $30,000. Whether you choose to gift singly or jointly, you've probably got a long way to go before using up the current $11.7 ($23.4 million for couples) lifetime exemption.

Grandparents, aunts, uncles, and parents too can fund 529 college saving plans this way, but it is worth noting that December 31st is the 529 funding deadline.

MAX OUT RETIREMENT PLANS

Most employers offer a 401(k) or 403(b) plan, and you have until December 31st to boost your contribution. This year, the contribution limit on both 401(k) and 403(b) plans is $19,500 for those under 50 (it's going up by $1,000 next year) and $26,000 for those 50 and older. This year, the traditional and Roth individual retirement account contribution limits are $6,000 for those under 50 and $7,000 for those 50 and older.

But be careful because high earners face contribution ceilings based on their adjusted gross income level.

Remember IRA cash-outs. Once you reach age 72 you are required to take annual Required Minimum Distributions (RMDs) from your retirement accounts.

Your first RMD must be taken by April 1st of the year after you turn 72. Subsequent RMDs must be taken by December 31st of each year. If you don't take your RMD, you'll have to pay a penalty of 50% of the RMD amount.

Did you inherit an IRA? If you have and you weren't married to the person who started that IRA, you must take the first RMD from that IRA by December 31st of the year after the death of that original IRA owner. You have to do it whether the account is a traditional or a Roth IRA.

Consider dividing it into multiple inherited IRAs, thus extending the payout schedule for younger inheritors of those assets. Any co–beneficiaries receive distributions per the life expectancy of the oldest beneficiary. If you want to make this move, it must be done by the end of the year that follows the year in which the original IRA owner died.

If your spouse died, then, you should file Form 706 no later than nine months after his or her passing. This notifies the IRS that some or all of a decedent's estate tax exemption is carried over to the surviving spouse.

Business owners' retirement plans. If you have income from self-employment, you can save for the future using a self-directed retirement plan, such as a Simplified Employee Pension (SEP) plan or a one–person 401(k), the so-called Solo (k). You don't have to be exclusively self–employed to set one of these up – you can work full–time for someone else and contribute to one of these while also deferring some of your salary into the retirement plan sponsored by your employer.

Contributions to SEPs and Solo (k) s are tax–deductible. December 31st is the deadline to set one up, and if you meet that deadline, you can make your contributions as late as April 15th next year (or October 15th with a federal extension).

You can contribute up to $58,000 to a SEP and this rises to $61,000 next year.

If you contribute to a 401(k) at work, the sum of your employee salary deferrals plus your Solo (k) contributions can't be greater than the $19,500/$26,000 limits. But even so, you can still pour up to 25% of your net self-employment income into a Solo (k).

IRS INCREASES CONTRIBUTION LIMITS FOR NEXT YEAR

The Internal Revenue Service announced that the amount individuals can contribute to their 401(k) plans in 2022 has increased to $20,500, up from $19,500 for 2021 and 2020.

From the IRS website:

Highlights of Changes for 2022

"The contribution limit for employees who participate in 401(k), 403(b), most 457 plans, and the federal government's Thrift Savings Plan is increased to $20,500, up from $19,500. The income ranges for determining eligibility to make deductible contributions to traditional Individual Retirement Arrangements (IRAs), to contribute to Roth IRAs, and to claim the Saver's Credit all increased for 2022.

Taxpayers can deduct contributions to a traditional IRA if they meet certain conditions. If during the year either the taxpayer or the taxpayer's spouse was covered by a retirement plan at work, the deduction may be reduced, or phased out, until it is eliminated, depending on filing status and income. (If neither the taxpayer nor the spouse is covered by a retirement plan at work, the phase–outs of the deduction do not apply.) Here are the phase–out ranges for 2022:

  • For single taxpayers covered by a workplace retirement plan, the phase–out range is increased to $68,000 to $78,000, up from $66,000 to $76,000.

  • For married couples filing jointly, if the spouse making the IRA contribution is covered by a workplace retirement plan, the phase–out range is increased to $109,000 to $129,000, up from $105,000 to $125,000.

  • For an IRA contributor who is not covered by a workplace retirement plan and is married to someone who is covered, the phase–out range is increased to $204,000 to $214,000, up from $198,000 to $208,000.

  • For a married individual filing a separate return who is covered by a workplace retirement plan, the phase–out range is not subject to an annual cost–of–living adjustment and remains $0 to $10,000.

The income phase–out range for taxpayers making contributions to a Roth IRA is increased to $129,000 to $144,000 for singles and heads of household, up from $125,000 to $140,000. For married couples filing jointly, the income phase-out range is increased to $204,000 to $214,000, up from $198,000 to $208,000. The phase–out range for a married individual filing a separate return who makes contributions to a Roth IRA is not subject to an annual cost–of–living adjustment and remains $0 to $10,000.

The income limit for the Saver's Credit (also known as the Retirement Savings Contributions Credit) for low- and moderate–income workers is $68,000 for married couples filing jointly, up from $66,000; $51,000 for heads of household, up from $49,500; and $34,000 for singles and married individuals filing separately, up from $33,000.

The amount individuals can contribute to their SIMPLE retirement accounts is increased to $14,000, up from $13,500.

Key Employee Contribution Limits That Remain Unchanged

The limit on annual contributions to an IRA remains unchanged at $6,000. The IRA catch–up contribution limit for individuals aged 50 and over is not subject to an annual cost–of–living adjustment and remains $1,000.

The catch-up contribution limit for employees aged 50 and over who participate in 401(k), 403(b), most 457 plans, and the federal government's Thrift Savings Plan remains unchanged at $6,500. Therefore, participants in 401(k), 403(b), most 457 plans, and the federal government's Thrift Savings Plan who are 50 and older can contribute up to $27,000, starting in 2022. The catch–up contribution limit for employees aged 50 and over who participate in SIMPLE plans remains unchanged at $3,000."

Q3 2021 Financial Update
Third Quarter 2021

Quarterly Market Commentary: Third Quarter 2021 

Markets Struggle in the Third Quarter

Global equity markets had a mixed third quarter, but when the final Wall Street-bell chimed on September 30th, global markets had not moved very much, despite the final month of the quarter turning in dismal results.

For the third quarter of 2021:

  • The DJIA ended 3Q with a loss of 1.5%;

  • The S&P 500 ended 3Q with a gain of 0.6%;

  • NASDAQ ended 3Q with a loss of 0.2%; and

  • The Russell 2000 ended 3Q with a loss of 4.4%.

But many are trying not to focus on the mixed returns for 3Q (and dismal September returns) and are instead focusing on how the market performed for the first nine months of the year – and those numbers are solid, as:

  • The DJIA is up 12.1% YTD;

  • The S&P 500 is up 15.9% YTD;

  • NASDAQ is up 12.7% YTD; and

  • The Russell 2000 is up 12.4% YTD.

Interestingly, the themes that helped drive market performance have been on Wall Street’s worry list for a while and did not just appear on July 1st. Topping the worry list was rising inflation, the Federal Reserve’s schedule of remaining accommodative; declining consumer sentiment; overheating housing; concerns that the delta variant might stall economic activity; and disappointing economic data hampered by supply chain issues.

Further, we saw that:

  • Volatility, as measured by the VIX, trended up in the third quarter, starting slightly over 15 and ending the month at 23.

  • West Texas Intermediate crude did not move much in the third quarter, starting and ending just north of $75/barrel. Further, WTI has climbed more than 50% in six months, having started 2021 at $48/barrel.

Market Performance Around the World

Investors were not thrilled with the quarterly performance around the world, as 32 of the 35 developed markets tracked by MSCI were negative for the third quarter of the year. And of the 40 developing markets tracked by MSCI, 26 of them were negative too.

Source: MSCI. Past performance cannot guarantee future results

Source: MSCI. Past performance cannot guarantee future results

Again, the themes that helped drive market performance this month have been on Wall Street’s worry list for a long time and did not magically appear when the third quarter kicked off. 

In fact, the worries of rising inflation; the Federal Reserve’s schedule of remaining accommodative; declining consumer sentiment; overheating housing; the delta variant; and supply chain issues have all been around for many months (inflation has gone up every month in 2021, for example). 

But the third quarter did see a few more troublesome topics added to that long worry list, including:

  • Treasury Secretary Janet Yellen warning of economic catastrophe if Congress did not raise the debt ceiling limit;

  • A hotly-debated infrastructure bill that could carry a price tag of at least $1 trillion and up to $3.5 trillion;

  • Skyrocketing shipping fees heading into the holiday season as container ships are anchored outside U.S. ports waiting to be unloaded;

  • Rising unemployment applications for the last 3 weeks of the month; and

  • China’s Evergrande Group risking default on its debt and sending shock-waves throughout global markets, similar to when Lehman Brothers collapsed (13 years ago to the day) and kicked off the Financial Crisis of 2008.

And as if we need another reminder about inflation, the number of companies warning of inflation on their latest earnings calls hit an all-time high too.

S&P 500

Finally, while glass-half-empty economists were busy reminding us all month that September has historically the worst month for stocks, now they’re preaching that October has historically been the most volatile month for stocks. So, is it any surprise that stocks struggled with this growing Wall of Worry?

September Lived Up to Its Billing

All the major U.S. equity markets and virtually all the developed and emerging markets tracked by MSCI were down for the month of September, in keeping in line with what has historically been the worst month for stocks. For the month of September:

  • The DJIA was down 4.3%;

  • The S&P 500 was down 4.8%;

  • NASDAQ was down 5.3%; and

  • The Russell 2000 was down 3.6%.

Further, the S&P 500 and NASDAQ both turned in their worst months since the height of the pandemic in March 2020.

IPOs on Fire

The IPO market was on fire during the third quarter, with a stunning record amount of activity on the M&A and IPO front. Here are some statistics for perspective:

  • Q3’s global M&A activity produced deals worth more than $1.5 trillion, which is 38% more than the highest quarter on record

  • Global M&A activity through the first nine months of 2021 reached more than $4.3 trillion, which trounces the annual record of $4.1 trillion

  • There has been a crazily historic 770 U.S. IPOs over the first three quarters of 2021 and that is a whopping 3x the ten-year average of 205

  • SPACs make up 58% of this year’s IPOs, but the 323 non-SPAC IPOs are already greater than any year since 2008

Sector Performance Rotated in Q32021

The overall trend for sector performance for each of the first nine months and the first, second and third quarters was good, but the performance leaders and laggards did rotate throughout, suggesting that a few sector rotations may have occurred in just 9 months. 

For perspective, recall that this time last year, the third quarter of 2020 ended with 10 of the 11 S&P 500 sectors painted green. Fast forward a year later and 5 of the 11 are painted red.

Here are the sector returns for the shorter time periods:

Source: FMR

Source: FMR

Reviewing the sector returns for just the third quarter of 2021, we saw that:

  • 5 of the 11 sectors were painted green for the third quarter;

  • The Energy sector turned in another volatile quarter, this time retreating as the price of oil barely moved, whereas last quarter Energy led the other sectors as the price of oil leapt by $15/barrel;

  • The Financials sector turned in another solid quarter, helped by the Federal Reserve’s stance of keeping rates low through at least 2023; and

  • The differences between the best (+2.77%) performing and worst (-3.71%) performing sectors in the third quarter widened.

Asset Class & Style Performance

The second quarter and first six months of 2021 were good for almost all investors, with most of the major asset classes and styles turning in very respectable – and most importantly green – numbers across the board. 

For the quarter, Commodities continued their spectacularly red-hot pace, Growth outpaced Value and small-caps lagged the larger caps. 

Source: Barclays, Bloomberg, FactSet, FTSE, MSCI, J.P. Morgan Asset Management. DM Equities: MSCI World; REITs: FTSE NAREIT All REITs; Cmdty: Bloomberg UBS Commodity Index; Global Agg: Barclays Global Aggregate; Growth: MSCI World Growth; Value: MSCI World Value; Small cap: MSCI World Small Cap. All indices are total return in local currency. Past performance is not a reliable indicator of current and future results.

Source: Barclays, Bloomberg, FactSet, FTSE, MSCI, J.P. Morgan Asset Management. DM Equities: MSCI World; REITs: FTSE NAREIT All REITs; Cmdty: Bloomberg UBS Commodity Index; Global Agg: Barclays Global Aggregate; Growth: MSCI World Growth; Value: MSCI World Value; Small cap: MSCI World Small Cap. All indices are total return in local currency. Past performance is not a reliable indicator of current and future results.

Turning to Commodities, which jumped another 6% for the quarter to add to its almost 30% gain YTD, it should be noted that 14 of the last 17 months have seen gains. Further, that almost 30% gain YTD represents its largest annual gain since 1979. 

Natural gas has gone through the roof with a YTD gain of 135% and WTI Crude oil is up 55% YTD. Supply and demand challenges are driving energy prices higher, as the summer driving season saw record-high gasoline demand and supplies were disrupted by hurricane season.

Consumer Confidence Sinks Again

On September 28th, the Conference Board announced that its Consumer Confidence Index declined in September, after declining in both July and August. The Index now stands at 109.3 (1985=100), down from 115.2 in August. And only 19% of consumers think business conditions are good, whereas 25% think conditions are bad.

“Concerns about the state of the economy and short-term growth prospects deepened, while spending intentions for homes, autos, and major appliances all retreated again. Short-term inflation concerns eased somewhat, but remain elevated,” read the press release from the Conference Board.


Consumer Confidence Index(R)

Inflation Keeps Rising

The Bureau of Labor Statistics reported that the Consumer Price Index for All Urban Consumers increased 0.3% in August on a seasonally adjusted basis after rising 0.5% in July. Over the last 12 months, the All Items index increased 5.3%.

A few highlights:

  • The indexes for gasoline, household furnishings and operations, food, and shelter all rose in August and contributed to the monthly all items seasonally adjusted increase.

  • The energy index increased 2.0%, mainly due to a 2.8% increase in the gasoline index.

  • The index for food rose 0.4%, with the indexes for food at home and food away from home both increasing 0.4%.

Some Positive Inflation News Maybe?

Here is some good news on the monthly inflation increases (maybe):

  • The index for dairy and related products declined in August, falling 1.0% after rising in each of the previous 4 months.

  • There was a sharp decline in the index for food at employee sites and schools, which fell 17% in August.

  • The index for airline fares fell sharply, decreasing 9.1% over the month.

  • The index for used cars and trucks declined 1.5% in August, ending a series of five consecutive monthly increases.

GDP Up 6.7%

On the last day of the third quarter, the Bureau of Economic Analysis announced that real gross domestic product increased at an annual rate of 6.7% in the second quarter. In the first quarter, real GDP increased 6.3 percent.

Real GDP percent change

“The increase in real GDP in the second quarter reflected increases in PCE, nonresidential fixed investment, exports, and state and local government spending that were partly offset by decreases in private inventory investment, residential fixed investment, and federal government spending. Imports, which are a subtraction in the calculation of GDP, increased.”

Current Account Deficit Widens in 2Q

The U.S. Bureau of Economic Analysis announced that “the U.S. current account deficit, which reflects the combined balances on trade in goods and services and income flows between U.S. residents and residents of other countries, widened by $0.9 billion, or 0.5%, to $190.3 billion in the second quarter of 2021.

The second quarter deficit was 3.3% of current dollar gross domestic product, down from 3.4% in the first quarter. The $0.9 billion widening of the current account deficit in the second quarter mainly reflected reduced surpluses on services and on primary income that were mostly offset by a reduced deficit on secondary income.”

quarterly US Current account

Jobless Claims Up

On the last day of the quarter, the Department of Labor announced that for the week ending September 25th, the advance figure for seasonally adjusted initial claims was 362,000, an increase of 11,000 from the previous week's unrevised level of 351,000. In addition:

  • the 4-week moving average was 340,000, an increase of 4,250 from the previous week's unrevised average of 335,750.

  • The advance seasonally adjusted insured unemployment rate was 2.0% for the week ending September 18, a decrease of 0.1% from the previous week's unrevised rate.

  • The advance number for seasonally adjusted insured unemployment during the week ending September 18 was 2,802,000, a decrease of 18,000 from the previous week's revised level.

  • The 4-week moving average was 2,797,250, a decrease of 750 from the previous week's revised average. This is the lowest level for this average since March 21, 2020 when it was 2,071,750.

The highest insured unemployment rates in the week ending September 11 were in Puerto Rico (4.7), California (3.4), District of Columbia (3.2), Oregon (3.2), Alaska (3.1), Nevada (3.1), New Jersey (3.1), the Virgin Islands (3.1), Hawaii (2.7), and Illinois (2.7). 

The largest increases in initial claims for the week ending September 18 were in California (+17,218), Virginia (+12,140), Ohio (+4,147), Oregon (+3,413), and Maryland (+2,452), while the largest decreases were in Louisiana (-6,935), New York (-2,275), Missouri (-1,568), Oklahoma (-1,264), and New Mexico (-1,055).” 

Exports & Imports of Goods and Services 

“Exports of goods increased $28.3 billion, to $436.6 billion, mostly reflecting increases in industrial supplies and materials, mainly petroleum and products, and in capital goods, mainly civilian aircraft and semiconductors. 

  • Imports of goods increased $29.0 billion, to $706.3 billion, primarily reflecting an increase in industrial supplies and materials, mainly petroleum and products and metals and nonmetallic products.

  • Exports of services increased $7.6 billion, to $189.1 billion, primarily reflecting an increase in travel, mostly other personal travel.

  • Imports of services increased $9.1 billion, to $127.8 billion, mostly reflecting increases in transport, primarily sea freight and air passenger transport, and in travel, primarily other personal travel.”

quarterly US current account

Worries of a Government Shutdown?

On literally the last day of the month with just hours to spare, President Biden signed a bill extending government funding through December 3rd, averting a partial shutdown. But the debt-ceiling fight remains and is likely to dominate Wall Street’s Wall of Worry heading into October. 

Here is a very important thing to remember: if the debt ceiling is not raised and the government does shut down, it wouldn’t be the first time. In fact, it wouldn’t even be the twentieth time. 

Since 1976 the government has been shut down 22 times, the last being between December 22, 2018 until January 25, 2019 (35 days). If this happens, then yes, the stock market will likely react negatively. 

But for perspective, consider the impact to stock markets during the last 2013 and 2018/2019 shutdowns – stocks actually rose.

Source: FactSet

Source: FactSet

But remember, as always: past performance is never a guarantee of future results. 

Sources: census.gov; bea.gov; bls.gov; dol.gov; bea.gov; factset.com; msci.com; fidelity.comnasdaq.com; wsj.com; morningstar.com

Ivan Havrylyan
We've come so far

Headlines are looking grim again, so let's pause and take stock.

Why are the headlines terrible?

Because the media loves drama. This is not news to you or me or anyone who pays attention. The 24-hour news cycle is there to whip up emotions and keep us glued to the latest "BREAKING NEWS."

So, what’s behind the noise and should we worry?

Before we jump into unpacking the news, let’s take a moment and remind ourselves of how far we’ve come since the pandemic began.

You can see it right here in this chart:

8.26.21 - timely-email-how-far-weve-come.png

We've recovered the vast majority of jobs lost since the bottom of the pandemic's disruption last April. The economy is still missing several million jobs to regain pre-pandemic levels, but we've made up a lot of ground, and jobs growth is still strong.1

In fact, there are more job openings right now than job seekers to fill them.2

But there's an important caveat to the chart above.

The monthly jobs report is what economists call a "lagging" indicator, meaning that it's telling us where the economy was, not where it's going.

To figure out what might lie ahead, economists turn to "leading" economic indicators that help forecast future trends.

So, what are the leading indicators telling us about the economy?

A couple of the most popular indicators are manufacturing orders for long-lasting (durable) goods since companies don't like to order expensive equipment unless they expect to need it soon.

Another one is groundbreaking (starts) on new houses, which indicate how much demand builders expect for housing.

Let's take a look:

Both indicators suggest continued (if bumpy) growth. Now, those are just two sectors, and we want to be thorough, so let's take a look at a composite.

The Conference Board Leading Economic Index (LEI) gives us a quick overview each month of several indicators.

It increased by 0.7% in June, following a 1.2% increase in May, and a 1.3% increase in April, showing broad, but slowing growth.3

What does that tell us? That the economy still has legs.

Will the delta variant derail the recovery?

A serious slowdown due to the delta variant seems unlikely, but we could potentially see a bumpy fall, especially in vulnerable industries and areas with surging case counts.

There's also some potentially good news about the delta variant that we can take from other countries.

India and Great Britain both experienced delta-driven surges earlier this summer.4

And what happened?

A steep and scary rise in case counts and hospitalizations...followed by a rapid decline.

It seems that these fast-moving delta waves might burn themselves out.

Unfortunately, these surges come with a painful human cost to patients, overburdened medical staff, communities, and families.

But, if this pattern holds true in the U.S., it doesn't appear that the economic impact will be heavy enough to derail the recovery.

All this to say, it's clear that the pandemic is still not over.

But we've come such a long way since the darkest days of 2020 and the road ahead still seems bright (if a little potholed).

Please remember to take panicky headlines with a shaker or two of salt.

Tax worries? Info inside.

Are you tired of hearing about taxes?

Me too.

But here we are. Let's dive in.

So, we've got dueling infrastructure bills, plus a big proposed budget with lots of spending (and higher taxes inside).

That's a lot of expensive legislation on the table.

1.jpeg

What's going to happen next?

The Democrats and Republicans seem pretty far apart on their respective infrastructure deals, which opens up the possibility that Democrats could go it alone and try to pass a package entirely without Republican support.1

That would be very difficult to accomplish.

It's also possible that both parties could align around a smaller bill and then the Democrats attempt to pass any extras through budget reconciliation.

The bottom line, we don't have enough clarity to know what a final infrastructure deal will look like. Given the political hurdles, the debate might drag on through summer.2

How likely are taxes to go up?

Well, my crystal ball's about as clear as mud right now, but let's break down what we see on the table.

President Biden's $6 trillion proposed budget offers a lot of spending and higher taxes to pay for it.3 None of these tax hikes are a surprise as they are in line with what Biden has promised before.

Wealthy taxpayers are looking at a higher top income tax rate, higher capital gains taxes, and the loss of the step-up basis on inherited assets.

Corporations are also in the line of fire, facing an increase in corporate tax rates, which could affect profitability.

That's currently what's on the table.

However, Biden's desire to raise taxes faces major headwinds (even inside his own party). His proposed budget is very much a wish list and will face challenges getting approved by legislators.4

It's very possible that some (or all) of these proposed tax hikes will get axed during negotiations.

How likely is it that any tax hikes will be retroactive?

One of the big shockers coming out of recent tax news is that the higher capital gains taxes could be made retroactive to April 2021.5

There is a historical precedent for this as it has happened a number of times before.6 However, retroactive tax changes are often for tax decreases.

I think it's very unlikely for an increase to be retroactive. There is too much opposition from both sides of the aisle.

Bottom line, I do think that higher taxes are coming. But I'm not sure that they will be as big or far-reaching as the Biden administration wants.

With so much uncertainty around taxes, now is not a time to panic, but to think carefully and make adjustments where needed.

Please reach out if there's anything specific you need to discuss.

$50 burgers (should we worry about inflation?)

How much inflation can the country afford before we’re in trouble?

Let’s discuss.

First, let’s get on the same page about some basics.

If you’ve noticed the price of a thing increasing over time (say, your favorite candy bar or the cost of college tuition), that’s inflation in action.

Economists use the broad increase (or decrease) in prices of goods and services across the country as a measure of economic health.

When inflation is stable and predictable, it’s a sign of a basically healthy, growing economy.

But, high inflation can quickly eat away at the purchasing power of your dollars, indicating that the economy might be overheated.

Deflation, or a decline in prices, can be a warning sign of a shrinking economy.

Recent data highlighted a surprise spike in inflation, indicating that prices increased faster than economists expected last month.1

Could this be a worrisome sign that the economy is overheated? Could $50 burgers be in our future?

Maybe.

On the other hand, could it be a temporary blip caused by the economy emerging from the pandemic-driven slowdown, complicated by supply chain issues?

Very possible.

Are the headlines catastrophizing?

They usually are.

Let’s look at the data.

The Consumer Price Index (CPI), one of the major indexes economists use to track inflation, showed a surprising spike in April, igniting fears of runaway inflation.

Core CPI (which excludes the highly volatile categories of energy and food) showed a 0.9% increase in April month-over-month and 3.0% year-over-year. That’s much higher than the expected 0.3% and 2.3%, respectively.1

However, digging a bit deeper, we see that just two categories of goods (used cars and transportation services) accounted for the vast majority of the surge.2

approved 5.28.21 - timely-email-inflation-worries 2.png

That suggests things like flights and train travel suddenly became more expensive after a year of rock-bottom prices.

Is that runaway inflation or the normalization of prices as the world reopens?

We can't tell from a single data point, but it's not unusual to see prices increase in sectors that experienced a severe slowdown last year.

And the jump in used car prices? Well, many folks are turning to the second-hand market right now, in part because new cars are caught up in global supply chain bottlenecks for things like semiconductors and raw materials.3

Inflation is something to keep an eye on, especially in a year when so many of the usual variables have been thrown into flux. An ongoing surge in prices could hurt our wallets as our dollars buy less over time.

However, a single monthly spike following a very weird period for the economy is not cause for alarm yet; we should prepare ourselves for more odd numbers coming out of different parts of the economy in the weeks and months to come.

Shortages of everything from ketchup to gasoline could lead to price increases and fluctuations as supply chains attempt to disentangle from pandemic disruptions.4

Should we expect markets to react to inflation (and other) headlines?

A negative market reaction is not surprising after weeks of strong performance. We should expect volatility ahead as we (and the economy) adjust to a post-pandemic world.

Bottom line: Expect the unexpected in 2021.

Partnering with Outside The Box Financial Planning offers numerous benefits for individuals seeking retirement planning, small business support, wealth management, and beyond.  With their fiduciary duty, comprehensive approach, unbiased advice, transparent fee structure, and ongoing support, OTBFP act as a trusted advisor who prioritizes your best interests. Click here to schedule a complimentary “Fit” meeting to determine if we would make a good mutual fit.

Remember, financial decisions have long-lasting implications, and working with a professional can provide the expertise and guidance necessary to make informed choices that align with your financial aspirations. 

However, if you would like to take a shot at building a financial plan on your own, we offer our financial planning software, RightCapital, free of charge. Click here to get started.

Rescue bill (what's inside)

So, the next (final?) round of stimulus was signed into law by President Biden.

Let’s dive in.

The $1.9 trillion bill called the American Rescue Plan Act of 2021 includes stimulus checks, child tax credits, jobless help, vaccine-distribution money, healthcare subsidies, and aid for struggling restaurants. What’s not inside? A higher minimum wage. 

Here's a quick visual of how it compares to prior rounds of stimulus.

Approved 3.16.21 - timely-email-stimulus-recap.png


Here are some immediate takeaways: 

More stimulus checks are coming: $1,400 checks could be hitting bank accounts and mailboxes this month, going out to adults, children, and adult dependents such as college students and elders. These adult dependents did not qualify for previous payments, so that’s good news for many.1

Who gets paid? Individual filers who earn as much as $75,000 (or joint filers making $150,000), plus their household members, qualify for the full $1,400 per person.1

Folks filing as a head of household can earn up to $112,500 and still qualify for the full payment. Phaseouts kick in quickly this round, and an individual with an income of $80,000 or a couple earning $160,000 get nothing.1

Not sure if you qualify? The Washington Post put out a handy calculator to help you figure it out. (Accuracy not assured, etc., etc.)

If you’ve filed your 2020 taxes, your check would be based on that income. If not, it would be based on your 2019 tax filing. If you’re waiting for a missed payment, individual tax returns have an extra line called “recovery rebate credit” to claim your stimulus payment. 

Enhanced unemployment benefits are extended through Sept. 6: Folks claiming jobless benefits will receive $300/week on top of what they already get from their state through the fall.2

Some unemployment income is now tax-free: Individuals who earned less than $150,000 in 2020 can shield up to $10,200 in unemployment benefits from taxes. For married couples filing jointly who both received unemployment, the tax-free amount goes up to $20,400, but the $150,000 income cap still applies. Unfortunately, if you earn over $150,000, it currently appears that all of the unemployment benefits become taxable with no phaseout.3

If this applies to you or someone you love, my advice is to wait to file or update your tax return until the IRS issues guidance on what to do.

The child tax credit is larger: The bill increases the child tax credit for one year to $3,600 for kids under 6, and $3,000 for kids between 6 and 17 (the current credit is a flat $2,000 per child under 17). 50% of the credit would be available as advance monthly payments that the IRS will start sending to families in July 2021.4

Unfortunately, not all families will qualify. Phaseouts begin at $75,000 for single filers, $112,500 for heads of households, and $150,000 for joint filers. However, families who earn less than $200,000 ($400,000 for joint filers) could still claim the regular $2,000 credit.4

Health insurance costs could drop on health exchanges/marketplaces: The bill removes the income cap on insurance premium tax credits for folks who purchase insurance on the federal health exchange or state marketplace (for two years). That means the amount you would pay for health insurance would be limited to 8.5% of your income as calculated by the exchange.5

Final thoughts

A lot of rules have changed in the last year, throwing an already complex tax season into a bit of confusion.

If your AGI is over the thresholds above, there are still ways you can lower your AGI retroactively for 2020 and potentially qualify for the stimulus. Consult with your financial planner to see what options are available to you.

Could there be more stimulus passed this year? It seems unlikely if the U.S. economy continues to expand.

According to a fresh estimate, our economy will expand nearly twice as fast as originally expected, growing at an estimated 6.5% in 2021 versus the 3.2% projected in December.6

Obviously, these projections rest on a lot of assumptions about vaccination rates, reopening, and consumer spending.

Let’s hope we stay on track.

P.S. Markets have hit new highs as fears of out-of-control inflation faded and hopes about the recovery surged. The usual caveats apply: we're in a roaring bull market and any time stocks reach new highs, pullbacks and corrections are possible. Keep calm, cool, and focused. I'm here for questions.7

1https://www.washingtonpost.com/business/how-can-i-qualify-for-that-1400-stimulus-check/2021/03/10/419fa7bc-81e2-11eb-be22-32d331d87530_story.html

2https://www.cnet.com/personal-finance/weekly-300-unemployment-benefits-what-happens-now-with-new-stimulus-bill/

3https://www.cnbc.com/2021/03/09/covid-bill-waives-taxes-on-20400-of-unemployment-pay-for-couples.html

4https://www.kiplinger.com/taxes/602378/congress-passes-3000-child-tax-credit-for-2021

5https://www.cnbc.com/2021/03/10/health-insurance-costs-to-drop-for-millions-under-covid-relief-bill.html

6https://www.nytimes.com/2021/03/09/business/oecd-doubles-us-growth-forecast.html

7https://www.cnbc.com/2021/03/10/stock-market-open-to-close-news.html

Chart source: https://www.wsj.com/articles/whats-new-in-the-third-covid-19-stimulus-bill-11615285802

Risk Disclosure: Investing involves risk including the potential loss of principal. No investment strategy can guarantee a profit or protect against loss in periods of declining values. Past performance does not guarantee future results.

This material is for information purposes only and is not intended as an offer or solicitation with respect to the purchase or sale of any security. The content is developed from sources believed to be providing accurate information; no warranty, expressed or implied, is made regarding accuracy, adequacy, completeness, legality, reliability or usefulness of any information. Consult your financial professional before making any investment decision. For illustrative use only.

This information is not intended to be a substitute for specific individualized tax advice. We suggest that you discuss your specific situation with a qualified tax professional.

Ivan Havrylyan
2020 Global Market Commentary

2020 Global Market Commentary

1.22.21 approved - 2020 global market commentary.png

2020: A Tale of Two Markets

2020 can be summarized by the famous Charles Dickens line from A Tale of Two Cities:

“It was the best of times, it was the worst of times, it was the age of wisdom, it was the age of foolishness, it was the epoch of belief, it was the epoch of incredulity, it was the season of light, it was the season of darkness, it was the spring of hope, it was the winter of despair.”

Stock markets in the U.S. and around the globe turned in a very good year, despite two formidable headwinds that swirled around the economy and markets all year. COVID-19 and the elections of 2020 seemed to either slam markets with hurricane-like force or provide a steady wind in the market’s sails pushing markets to new record highs. There really were not many calm days.

In a nutshell, 2020 saw markets crest new highs at the beginning of the year, followed by a couple of corrections, the end of the longest bull market in history, a legitimate recession, a V-shaped recovery, and newer market highs. And along the way, we saw unemployment hit 50-year lows and then hit depression-era levels, multiple government stimulus programs, the best and worst quarterly GDP numbers of all time, a very active and aggressive Federal Reserve, social unrest throughout the country, negative oil prices, a frothy housing market and a major shift in Washington power. It was the best of times and the worst of times – in a single year.

But first, let’s do the numbers:

  • The DJIA rose 7.3% in 2020;

  • The S&P 500 rose 16.3% in 2020;

  • The Russell 2000 Index rose 19.9% in 2020; and

  • NASDAQ rose 43.6% in 2020.

Sector Returns in 2020

The overall trend for sector performance for each of the four quarters in 2020 and each of the 12 months was good, but the performance leaders and laggards did rotate all year. For example:

  • Q1 ended with every one of the 11 S&P 500 sectors turning in negative numbers;

  • Q2 ended with every one of the 11 sectors turning in positive numbers;

  • Q3 ended with 10 of the 11 positive; and

  • Q4 ended with all 11 sectors positive.

Here are the sector returns through the end of December 31, 2020:

1.22.21 approved -1 2020 global market commentary-1 (dragged).png

Reviewing the sector returns for 2020, we saw that:

  • 7 of the 11 sectors were painted green for the year;

  • The Financials sector had a wonderful final quarter, helped by the Federal Reserve’s stance of keeping rates low through 2023, although it was not enough to push the sector into positive territory for the year;

  • While the Energy sector also turned in a terrific fourth quarter, it was nowhere near enough to override its annual loss of more than 37%; and

  • On an annual basis, the difference between the best and worst-performing sectors is dramatic, as the Information Technology sector is up over 42% YTD and Energy is down a whopping 37%+.

Markets Around the World Performed Well

Strong performance in 2020 was not confined to the U.S., however, as most global markets also turned in a positive year. In fact, of the 35 of the developed markets tracked by MSCI, every single one was positive for 2020.

But that was not the case for developing markets, however, as 24 of the 40 developing markets tracked by MSCI turned in negative numbers for 2020 and the range between the best- and worst-performer was significant. To underscore the range, consider that the MSCI EM Europe Index lost 15.94% and MSCI Asia APEX 50 Index gained 31.32%. The following shows the range of 2020 returns from markets around the world:

1.22.21 approved -1 2020 global market commentary-2 (dragged).png

Asset Class & Style Performance

2020 was positive for many investors, but asset class and style played a huge role in determining total performance returns for investors.

For the year, Growth (+34.2%) outpaced Value (-0.4%) significantly and the smaller-cap names trailed their larger-cap counterparts for most of the year, although the differences between the two were mostly erased towards year-end.

Similarly, the larger emerging markets performed well, as evidenced by MSCI EM (+18.7) whereas the smaller emerging markets more often than not turned in negative numbers for the year. And Commodities and Global REITs struggled most of the year as well, eventually ending in the red.

1.22.21 approved -1 2020 global market commentary-2 (dragged) 2.png

The Federal Reserve Was in Overdrive

In dramatic and emergency actions to support the U.S. economy during the coronavirus pandemic, the Federal Reserve announced it would cut its target interest rate to near zero. And it announced its second rate cut on a Sunday no less.

The unexpected and faster-than-expected rate cut was on the heels of the Fed’s emergency 50 basis points rate cut just 12 days before – and that cut was the first time since October 2008 that our central bank decided to go ahead with a cut in between scheduled policy meetings.

Further, the Fed pledged its support to an aggressive quantitative easing program, suggesting that there was no limit on its purchases of Treasuries and agency mortgage-backed securities as well as purchasing investment-grade corporate bonds. The Fed also announced it would help maintain the flow of credit to municipalities around the country and establish a lending program for small businesses.

On top of all of that, the Fed also brokered a deal with other global central banks to lower their rates on currency swaps to bring normalcy to markets. The other central banks include the Bank of Canada, the Bank of England, the Bank of Japan, the European Central Bank, and the Swiss National Bank. And it appears that the Fed’s “zero-interest-rate-policy” will be in place through 2022 and maybe even through 2023.

Worst GDP Decline in History in 2Q

On September 30th, the Commerce Department reported that its “Third Estimate” of 2Q2020 GDP improved marginally to a decline of 31.4%. But saying it improved marginally seems disingenuous on its face because this 30%+ decline is on the heels of the 5% decline in the first quarter. And whether the number is 31.4% or 32.9% (from the second estimate), it’s still the worst quarterly decline in history – by a long shot.

1.22.21 approved -1 2020 global market commentary-3 (dragged).png

Best GDP Growth in History in 3Q

Then three days before Christmas, the U.S. Department of Commerce released the “third” estimate of real gross domestic product for the third quarter and the “third” estimate was revised upwards from 33.1% to 33.4%. This is of course on the heels of the 31.4% decrease in the second quarter.

1.22.21 approved -1 2020 global market commentary-3 (dragged) 2.png

According to the Bureau of Economic Analysis (within the Department of Commerce):

“The increase in real GDP reflected increases in PCE, private inventory investment, exports, nonresidential fixed investment, and residential fixed investment that were partly offset by decreases in federal government spending (reflecting fewer fees paid to administer the Paycheck Protection Program loans) and state and local government spending. Imports, which are a subtraction in the calculation of GDP, increased.

Wall Street Climbed a Wall of Worry

While the first quarter of 2020 was pockmarked with unprecedented and immediate stoppage of economic activity as businesses shut down and people stayed at home, every month of the second quarter of 2020 saw businesses slowly start to reopen, albeit not as fast as they shut down. The third-quarter was an extension of the third quarter, although results of the shutdowns started to show more prominently in corporate earnings reports. And the fourth quarter saw much of the same, but more negative news started to creep into various economic data sets, including housing.

While many are happy to see 2020 in the rear-view mirror, the performance for 2020 for the major U.S. indices and most of the developed, international markets was nothing short of impressive, especially given the headwinds of COVID-19 and the drama surrounding the 2020 elections. And as we enter a New Year, those headwinds have not evaporated completely, but they are beginning to diminish.

Let’s hope that 2021 is “the best of times, the age of wisdom, the epoch of belief, the season of light, and the spring of hope.”

Sources: msci.com; fidelity.com;nasdaq.com; wsj.com; morningstar.com