$50 burgers (should we worry about inflation?)

How much inflation can the country afford before we’re in trouble?

Let’s discuss.

First, let’s get on the same page about some basics.

If you’ve noticed the price of a thing increasing over time (say, your favorite candy bar or the cost of college tuition), that’s inflation in action.

Economists use the broad increase (or decrease) in prices of goods and services across the country as a measure of economic health.

When inflation is stable and predictable, it’s a sign of a basically healthy, growing economy.

But, high inflation can quickly eat away at the purchasing power of your dollars, indicating that the economy might be overheated.

Deflation, or a decline in prices, can be a warning sign of a shrinking economy.

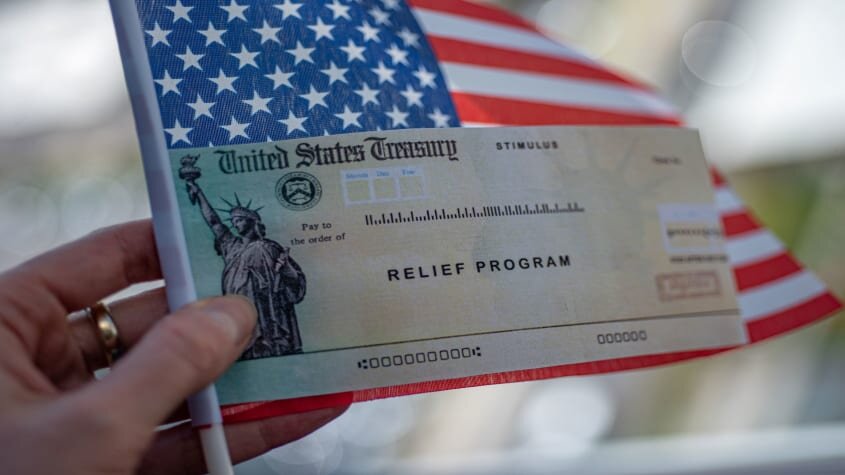
Recent data highlighted a surprise spike in inflation, indicating that prices increased faster than economists expected last month.1

Could this be a worrisome sign that the economy is overheated? Could $50 burgers be in our future?

Maybe.

On the other hand, could it be a temporary blip caused by the economy emerging from the pandemic-driven slowdown, complicated by supply chain issues?

Very possible.

Are the headlines catastrophizing?

They usually are.

Let’s look at the data.

The Consumer Price Index (CPI), one of the major indexes economists use to track inflation, showed a surprising spike in April, igniting fears of runaway inflation.

Core CPI (which excludes the highly volatile categories of energy and food) showed a 0.9% increase in April month-over-month and 3.0% year-over-year. That’s much higher than the expected 0.3% and 2.3%, respectively.1

However, digging a bit deeper, we see that just two categories of goods (used cars and transportation services) accounted for the vast majority of the surge.2

approved 5.28.21 - timely-email-inflation-worries 2.png

That suggests things like flights and train travel suddenly became more expensive after a year of rock-bottom prices.

Is that runaway inflation or the normalization of prices as the world reopens?

We can't tell from a single data point, but it's not unusual to see prices increase in sectors that experienced a severe slowdown last year.

And the jump in used car prices? Well, many folks are turning to the second-hand market right now, in part because new cars are caught up in global supply chain bottlenecks for things like semiconductors and raw materials.3

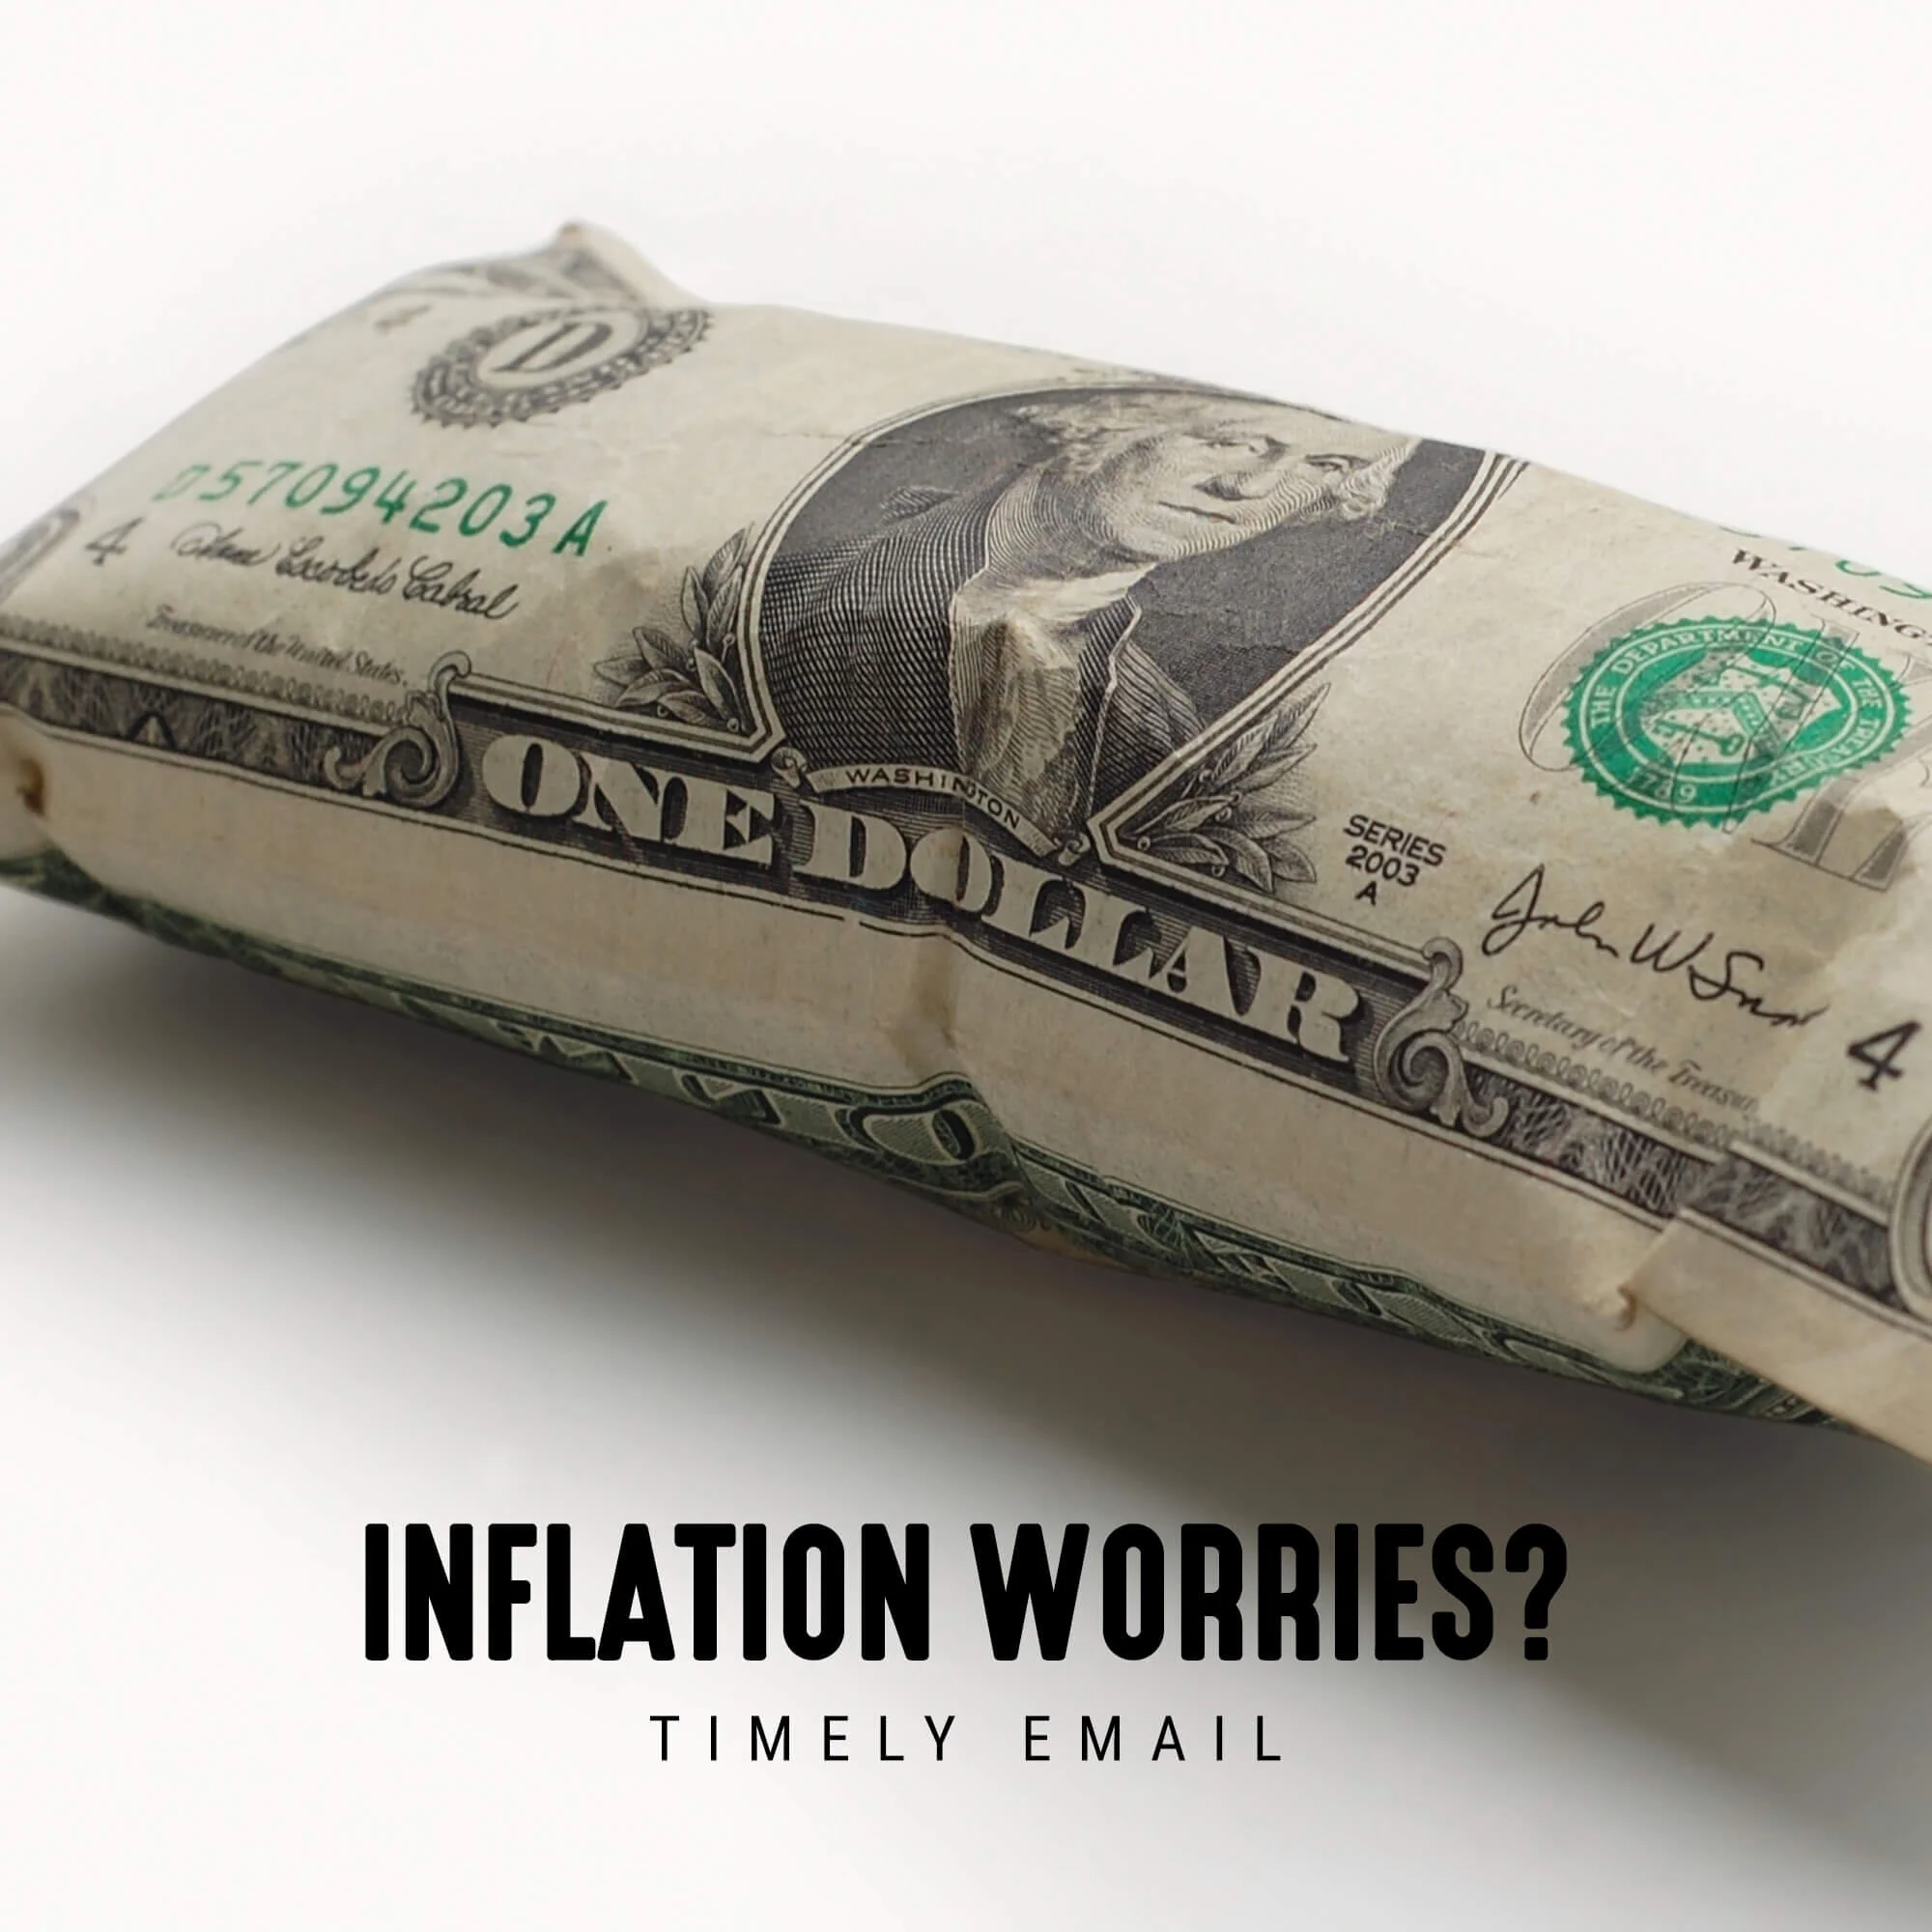
Inflation is something to keep an eye on, especially in a year when so many of the usual variables have been thrown into flux. An ongoing surge in prices could hurt our wallets as our dollars buy less over time.

However, a single monthly spike following a very weird period for the economy is not cause for alarm yet; we should prepare ourselves for more odd numbers coming out of different parts of the economy in the weeks and months to come.

Shortages of everything from ketchup to gasoline could lead to price increases and fluctuations as supply chains attempt to disentangle from pandemic disruptions.4

Should we expect markets to react to inflation (and other) headlines?

A negative market reaction is not surprising after weeks of strong performance. We should expect volatility ahead as we (and the economy) adjust to a post-pandemic world.

Bottom line: Expect the unexpected in 2021.

Partnering with Outside The Box Financial Planning offers numerous benefits for individuals seeking retirement planning, small business support, wealth management, and beyond.  With their fiduciary duty, comprehensive approach, unbiased advice, transparent fee structure, and ongoing support, OTBFP act as a trusted advisor who prioritizes your best interests. Click here to schedule a complimentary “Fit” meeting to determine if we would make a good mutual fit.

Remember, financial decisions have long-lasting implications, and working with a professional can provide the expertise and guidance necessary to make informed choices that align with your financial aspirations. 

However, if you would like to take a shot at building a financial plan on your own, we offer our financial planning software, RightCapital, free of charge. Click here to get started.

Rescue bill (what's inside)

So, the next (final?) round of stimulus was signed into law by President Biden.

Let’s dive in.

The $1.9 trillion bill called the American Rescue Plan Act of 2021 includes stimulus checks, child tax credits, jobless help, vaccine-distribution money, healthcare subsidies, and aid for struggling restaurants. What’s not inside? A higher minimum wage. 

Here's a quick visual of how it compares to prior rounds of stimulus.

Approved 3.16.21 - timely-email-stimulus-recap.png


Here are some immediate takeaways: 

More stimulus checks are coming: $1,400 checks could be hitting bank accounts and mailboxes this month, going out to adults, children, and adult dependents such as college students and elders. These adult dependents did not qualify for previous payments, so that’s good news for many.1

Who gets paid? Individual filers who earn as much as $75,000 (or joint filers making $150,000), plus their household members, qualify for the full $1,400 per person.1

Folks filing as a head of household can earn up to $112,500 and still qualify for the full payment. Phaseouts kick in quickly this round, and an individual with an income of $80,000 or a couple earning $160,000 get nothing.1

Not sure if you qualify? The Washington Post put out a handy calculator to help you figure it out. (Accuracy not assured, etc., etc.)

If you’ve filed your 2020 taxes, your check would be based on that income. If not, it would be based on your 2019 tax filing. If you’re waiting for a missed payment, individual tax returns have an extra line called “recovery rebate credit” to claim your stimulus payment. 

Enhanced unemployment benefits are extended through Sept. 6: Folks claiming jobless benefits will receive $300/week on top of what they already get from their state through the fall.2

Some unemployment income is now tax-free: Individuals who earned less than $150,000 in 2020 can shield up to $10,200 in unemployment benefits from taxes. For married couples filing jointly who both received unemployment, the tax-free amount goes up to $20,400, but the $150,000 income cap still applies. Unfortunately, if you earn over $150,000, it currently appears that all of the unemployment benefits become taxable with no phaseout.3

If this applies to you or someone you love, my advice is to wait to file or update your tax return until the IRS issues guidance on what to do.

The child tax credit is larger: The bill increases the child tax credit for one year to $3,600 for kids under 6, and $3,000 for kids between 6 and 17 (the current credit is a flat $2,000 per child under 17). 50% of the credit would be available as advance monthly payments that the IRS will start sending to families in July 2021.4

Unfortunately, not all families will qualify. Phaseouts begin at $75,000 for single filers, $112,500 for heads of households, and $150,000 for joint filers. However, families who earn less than $200,000 ($400,000 for joint filers) could still claim the regular $2,000 credit.4

Health insurance costs could drop on health exchanges/marketplaces: The bill removes the income cap on insurance premium tax credits for folks who purchase insurance on the federal health exchange or state marketplace (for two years). That means the amount you would pay for health insurance would be limited to 8.5% of your income as calculated by the exchange.5

Final thoughts

A lot of rules have changed in the last year, throwing an already complex tax season into a bit of confusion.

If your AGI is over the thresholds above, there are still ways you can lower your AGI retroactively for 2020 and potentially qualify for the stimulus. Consult with your financial planner to see what options are available to you.

Could there be more stimulus passed this year? It seems unlikely if the U.S. economy continues to expand.

According to a fresh estimate, our economy will expand nearly twice as fast as originally expected, growing at an estimated 6.5% in 2021 versus the 3.2% projected in December.6

Obviously, these projections rest on a lot of assumptions about vaccination rates, reopening, and consumer spending.

Let’s hope we stay on track.

P.S. Markets have hit new highs as fears of out-of-control inflation faded and hopes about the recovery surged. The usual caveats apply: we're in a roaring bull market and any time stocks reach new highs, pullbacks and corrections are possible. Keep calm, cool, and focused. I'm here for questions.7

1https://www.washingtonpost.com/business/how-can-i-qualify-for-that-1400-stimulus-check/2021/03/10/419fa7bc-81e2-11eb-be22-32d331d87530_story.html

2https://www.cnet.com/personal-finance/weekly-300-unemployment-benefits-what-happens-now-with-new-stimulus-bill/

3https://www.cnbc.com/2021/03/09/covid-bill-waives-taxes-on-20400-of-unemployment-pay-for-couples.html

4https://www.kiplinger.com/taxes/602378/congress-passes-3000-child-tax-credit-for-2021

5https://www.cnbc.com/2021/03/10/health-insurance-costs-to-drop-for-millions-under-covid-relief-bill.html

6https://www.nytimes.com/2021/03/09/business/oecd-doubles-us-growth-forecast.html

7https://www.cnbc.com/2021/03/10/stock-market-open-to-close-news.html

Chart source: https://www.wsj.com/articles/whats-new-in-the-third-covid-19-stimulus-bill-11615285802

Risk Disclosure: Investing involves risk including the potential loss of principal. No investment strategy can guarantee a profit or protect against loss in periods of declining values. Past performance does not guarantee future results.

This material is for information purposes only and is not intended as an offer or solicitation with respect to the purchase or sale of any security. The content is developed from sources believed to be providing accurate information; no warranty, expressed or implied, is made regarding accuracy, adequacy, completeness, legality, reliability or usefulness of any information. Consult your financial professional before making any investment decision. For illustrative use only.

This information is not intended to be a substitute for specific individualized tax advice. We suggest that you discuss your specific situation with a qualified tax professional.

Ivan Havrylyan
2020 Global Market Commentary

2020 Global Market Commentary

1.22.21 approved - 2020 global market commentary.png

2020: A Tale of Two Markets

2020 can be summarized by the famous Charles Dickens line from A Tale of Two Cities:

“It was the best of times, it was the worst of times, it was the age of wisdom, it was the age of foolishness, it was the epoch of belief, it was the epoch of incredulity, it was the season of light, it was the season of darkness, it was the spring of hope, it was the winter of despair.”

Stock markets in the U.S. and around the globe turned in a very good year, despite two formidable headwinds that swirled around the economy and markets all year. COVID-19 and the elections of 2020 seemed to either slam markets with hurricane-like force or provide a steady wind in the market’s sails pushing markets to new record highs. There really were not many calm days.

In a nutshell, 2020 saw markets crest new highs at the beginning of the year, followed by a couple of corrections, the end of the longest bull market in history, a legitimate recession, a V-shaped recovery, and newer market highs. And along the way, we saw unemployment hit 50-year lows and then hit depression-era levels, multiple government stimulus programs, the best and worst quarterly GDP numbers of all time, a very active and aggressive Federal Reserve, social unrest throughout the country, negative oil prices, a frothy housing market and a major shift in Washington power. It was the best of times and the worst of times – in a single year.

But first, let’s do the numbers:

  • The DJIA rose 7.3% in 2020;

  • The S&P 500 rose 16.3% in 2020;

  • The Russell 2000 Index rose 19.9% in 2020; and

  • NASDAQ rose 43.6% in 2020.

Sector Returns in 2020

The overall trend for sector performance for each of the four quarters in 2020 and each of the 12 months was good, but the performance leaders and laggards did rotate all year. For example:

  • Q1 ended with every one of the 11 S&P 500 sectors turning in negative numbers;

  • Q2 ended with every one of the 11 sectors turning in positive numbers;

  • Q3 ended with 10 of the 11 positive; and

  • Q4 ended with all 11 sectors positive.

Here are the sector returns through the end of December 31, 2020:

1.22.21 approved -1 2020 global market commentary-1 (dragged).png

Reviewing the sector returns for 2020, we saw that:

  • 7 of the 11 sectors were painted green for the year;

  • The Financials sector had a wonderful final quarter, helped by the Federal Reserve’s stance of keeping rates low through 2023, although it was not enough to push the sector into positive territory for the year;

  • While the Energy sector also turned in a terrific fourth quarter, it was nowhere near enough to override its annual loss of more than 37%; and

  • On an annual basis, the difference between the best and worst-performing sectors is dramatic, as the Information Technology sector is up over 42% YTD and Energy is down a whopping 37%+.

Markets Around the World Performed Well

Strong performance in 2020 was not confined to the U.S., however, as most global markets also turned in a positive year. In fact, of the 35 of the developed markets tracked by MSCI, every single one was positive for 2020.

But that was not the case for developing markets, however, as 24 of the 40 developing markets tracked by MSCI turned in negative numbers for 2020 and the range between the best- and worst-performer was significant. To underscore the range, consider that the MSCI EM Europe Index lost 15.94% and MSCI Asia APEX 50 Index gained 31.32%. The following shows the range of 2020 returns from markets around the world:

1.22.21 approved -1 2020 global market commentary-2 (dragged).png

Asset Class & Style Performance

2020 was positive for many investors, but asset class and style played a huge role in determining total performance returns for investors.

For the year, Growth (+34.2%) outpaced Value (-0.4%) significantly and the smaller-cap names trailed their larger-cap counterparts for most of the year, although the differences between the two were mostly erased towards year-end.

Similarly, the larger emerging markets performed well, as evidenced by MSCI EM (+18.7) whereas the smaller emerging markets more often than not turned in negative numbers for the year. And Commodities and Global REITs struggled most of the year as well, eventually ending in the red.

1.22.21 approved -1 2020 global market commentary-2 (dragged) 2.png

The Federal Reserve Was in Overdrive

In dramatic and emergency actions to support the U.S. economy during the coronavirus pandemic, the Federal Reserve announced it would cut its target interest rate to near zero. And it announced its second rate cut on a Sunday no less.

The unexpected and faster-than-expected rate cut was on the heels of the Fed’s emergency 50 basis points rate cut just 12 days before – and that cut was the first time since October 2008 that our central bank decided to go ahead with a cut in between scheduled policy meetings.

Further, the Fed pledged its support to an aggressive quantitative easing program, suggesting that there was no limit on its purchases of Treasuries and agency mortgage-backed securities as well as purchasing investment-grade corporate bonds. The Fed also announced it would help maintain the flow of credit to municipalities around the country and establish a lending program for small businesses.

On top of all of that, the Fed also brokered a deal with other global central banks to lower their rates on currency swaps to bring normalcy to markets. The other central banks include the Bank of Canada, the Bank of England, the Bank of Japan, the European Central Bank, and the Swiss National Bank. And it appears that the Fed’s “zero-interest-rate-policy” will be in place through 2022 and maybe even through 2023.

Worst GDP Decline in History in 2Q

On September 30th, the Commerce Department reported that its “Third Estimate” of 2Q2020 GDP improved marginally to a decline of 31.4%. But saying it improved marginally seems disingenuous on its face because this 30%+ decline is on the heels of the 5% decline in the first quarter. And whether the number is 31.4% or 32.9% (from the second estimate), it’s still the worst quarterly decline in history – by a long shot.

1.22.21 approved -1 2020 global market commentary-3 (dragged).png

Best GDP Growth in History in 3Q

Then three days before Christmas, the U.S. Department of Commerce released the “third” estimate of real gross domestic product for the third quarter and the “third” estimate was revised upwards from 33.1% to 33.4%. This is of course on the heels of the 31.4% decrease in the second quarter.

1.22.21 approved -1 2020 global market commentary-3 (dragged) 2.png

According to the Bureau of Economic Analysis (within the Department of Commerce):

“The increase in real GDP reflected increases in PCE, private inventory investment, exports, nonresidential fixed investment, and residential fixed investment that were partly offset by decreases in federal government spending (reflecting fewer fees paid to administer the Paycheck Protection Program loans) and state and local government spending. Imports, which are a subtraction in the calculation of GDP, increased.

Wall Street Climbed a Wall of Worry

While the first quarter of 2020 was pockmarked with unprecedented and immediate stoppage of economic activity as businesses shut down and people stayed at home, every month of the second quarter of 2020 saw businesses slowly start to reopen, albeit not as fast as they shut down. The third-quarter was an extension of the third quarter, although results of the shutdowns started to show more prominently in corporate earnings reports. And the fourth quarter saw much of the same, but more negative news started to creep into various economic data sets, including housing.

While many are happy to see 2020 in the rear-view mirror, the performance for 2020 for the major U.S. indices and most of the developed, international markets was nothing short of impressive, especially given the headwinds of COVID-19 and the drama surrounding the 2020 elections. And as we enter a New Year, those headwinds have not evaporated completely, but they are beginning to diminish.

Let’s hope that 2021 is “the best of times, the age of wisdom, the epoch of belief, the season of light, and the spring of hope.”

Sources: msci.com; fidelity.com;nasdaq.com; wsj.com; morningstar.com

Season two of 2020?
1.22.21 approved - timely-email-politics-markets.jpg

Does it feel like 2021 yet?

The twists and turns so far make it seem like 2020 is dragging into a second season.

As an American, I’m shocked and worried, and I’m wondering how political disagreements turned into excuses for violence.

As a financial professional, I know that the politics, protests, and rioting in DC are just one-factor affecting markets.

I honestly don’t know what will happen over the next few weeks, but I can help you understand how it affects you as an investor.

Why did markets surge the day the Capitol was attacked?

While the world watched the violence in DC with horror, markets quietly rallied to new records the same day.1

That’s weird, right?

Well, not really.

I think it boils down to a few things.

  1. Computers and algorithms are dispassionate, executing trades regardless of the larger world.

  2. Markets don't always react to short-term ugliness. Instead, they reflect expectations about economic and business growth plus a healthy dose of investor psychology.

  3. With elections officially at an end, political uncertainty has dissipated.

Overall, I think investors are looking past the immediate future and hoping that vaccines, increased economic stimulus, and economic growth paint a positive picture of the future.

The Democrats control the White House and Congress. What does that mean for investors?

If you’re like a lot of people, you might think that your party in power is good for markets and your party out of power is bad.

That makes for a stressful experience every four years, right?

Fortunately, that’s not the case at all. Markets are pretty rational with respect to politics and policy.

While businesses and investors generally dislike increased taxes and corporate regulation, the Democrats hold such slim majorities in the House and Senate that it limits their ability to pass many big policy changes.

Also, the Democrats’ immediate agenda is very likely to be focused on fighting the pandemic and passing more stimulus aid, both of which should support stock prices.

Does that mean markets will continue to rally?

No guarantees, unfortunately. With all the frothy market activity and rosy expectations about the future, bad news could knock stocks down a peg or two.

A correction is definitely possible, and some strategists think certain sectors are in a bubble.

The bottom line, expect more volatility.

What comes next?

I wish I could tell you.

I’m optimistic that the light at the end of the tunnel is getting closer and we can start going back to normal.

I’m proud of what scientists and medical professionals have been able to accomplish in such a short amount of time.

I’m grateful for the folks around me.

How about you?

What’s your take? I'm interested to hear your thoughts.

Let me know ivan@otbfinancialplanning.com

Stimulus Bill (what's inside)
1.5.21 approved - timely email new stimulus deal.jpg

Below is a quick update about the new economic relief package that was signed into law in December.

(Please share with anyone you know who could use a quick breakdown of the aid with some advice at the end.)

What’s in the box?

The rescue package includes:1

  • $600 direct payments to adults and dependent children

  • An extra $300/week in unemployment benefits through at least mid-March 2021

  • $325 billion in small business aid

  • Vaccine distribution funding

  • Food assistance for low-income households

  • Emergency rental relief

Who is eligible for the stimulus payments?

It appears that lawmakers are following slightly different income limits than they used for the CARES Act. Individuals who earned less than $75,000 in 2019, heads of household earning less than $112,500, and couples earning less than $150,000 are eligible for the full $600/person payment. The payment starts phasing out after $75,000 and disappears entirely for individuals earning more than $87,000 (or couples earning over $174,000).2

While dependent children under 17 will also receive $600 each, it doesn't appear that adult dependents like college students or elders qualify for the payments.3

If your family added dependents in 2020 or you earned too much in 2019 to qualify (but would qualify in 2020), you may not receive full payments immediately but can request additional money once you file your 2020 taxes. If you qualified based on your 2019 income but your 2020 income would have reduced your payment, you won't have to pay it back; nor will it count as taxable income.

How do I claim a stimulus payment?

Like the CARES Act payments earlier this year, the stimulus payment should end up in your bank account or arrive in the mail. If you’ve moved or changed bank accounts since you filed your taxes, you can update your address with the IRS here. It appears that you can’t update direct deposit information due to fraud risks.

What else do I need to know?

Small business relief: Congress included another round of relief for small business owners by extending the Paycheck Protection Program with another $284 billion in forgivable loans. Some of the funds will be set aside for very small businesses, and the PPP is now available to nonprofits and local media outlets.4

An extra $20 billion has also been appropriated for Economic Injury Disaster Loans for businesses in low-income communities, and $15 billion more is earmarked for live venues, movie theaters, and cultural institutions that have been financially damaged by the pandemic.

The deal also clarifies that PPP borrowers will be able to deduct expenses paid for with forgiven loans, clearing up a potentially nasty tax issue.

Unemployment benefits: The package also extends unemployment benefits of $300/week for another 11 weeks, beginning as early as December 27 and lasting at least until March 14, 2021. A benefits program specifically for contract and gig workers that was slated to expire at the end of the year is also extended through March.

What should I do with my payment?

If you’re one of the millions of Americans struggling to stay afloat right now, please use the stimulus payment to pay for your three basics: food, shelter, and medicine. If you’re in a better place, I’d recommend paying down any high-interest debt you’ve accumulated or increasing your emergency fund savings.

If you’re among the very fortunate who don’t need to shore up your finances, I’d recommend putting it toward your retirement savings, other financial goals, or investing it in yourself through a course or hobby.

That’s it for now. I hope you and your loved ones are safe, warm, and well.


P.S. Wherever there’s money, there are scammers after it. Please be on alert for “official-looking” emails asking you to open an attachment or click a link—they may contain malware. If you get a suspicious email, check the sender’s name and email address to make sure they’re not fake. When in doubt, delete the email. The IRS or Treasury department will not require you to follow emailed instructions to receive a stimulus check.

P.P.S. Some great news to share: Over 4 million Americans have been vaccinated against COVID-19! That’s the power of human ingenuity and collective effort. I'm so grateful to be seeing some light at the end of this dark tunnel!5

1https://www.washingtonpost.com/business/2020/12/20/stimulus-package-details/

https://www.wsj.com/articles/what-is-in-the-900-billion-covid-19-aid-bill-11608557531

2https://www.wsj.com/articles/stimulus-checks-round-2-when-will-they-arrive-how-much-will-they-be-11608561726

3https://www.washingtonpost.com/graphics/business/coronavirus-stimulus-check-calculator/

4https://www.cbsnews.com/news/stimulus-check-600-dollars-eligibility-2020-12-21/

5https://www.nytimes.com/interactive/2020/us/covid-19-vaccine-doses.html

Should Investors Worry About September?
Should Investors Worry About September.png

September has historically been the worst month of the year for investors. So much for the notion of “Sell in May and Go Away.” If you subscribed to that so-called market strategy in 2020, here is what you would have missed:

The S&P 500 was up:

  • 4.5% in May;

  • 1.8% in June;

  • 5.5% in July; and

  • 7.0% in August.

And don’t forget, those four months of S&P 500 gains were on the heels of April’s 12.7% increase.

Five consecutive up-months for the S&P 500. And the S&P 500 just recorded its best August since 1986. If you need more stunningly good news, consider this:

  • Over the past 5 months, the S&P 500 is up 35.4% – its best five-month run since October 1938.

The notion of “Sell in May and Go Away” seems downright absurd right now, doesn’t it?

But now we’re headed into September – historically the worst month for the stock market. Will this time be different?

The September Swoon

The “September Swoon” is a seasonal trend in the stock market and one that has been well documented by researchers and the press.  The fact is, September has historically been the worst month on the calendar for stocks – from 1928 through 2019, the S&P 500 Index has fallen an average of 1.0% in September, according to Standard & Poor’s and Haver Analytics.  February averages -0.1% and May averages -0.2%, the only other months with an average loss over those 90+ years.

Seasonal Trends

Seasonality is based only on the analysis of years of historical data.  A seasonal trend is discovered if a pattern emerges in this analysis, in terms of average performance in a certain month.

It’s important to remember, however, that due to financial, psychological, and political factors, stock market behavior can run completely contrary to the seasonal trend in a given year (as it did in 2019, 2018 and 2017). 

Because the stock market in September has shown markedly different behavior, on average, for 90+ years, these results are not coincidental.  There is a genuine seasonal trend.

Possible Reasons for the September Swoon

So, why does the stock market generally drop in September?  What causes the September Swoon?  Economists and financial analysts have studied this topic, but no one has reached a definitive conclusion.  Here are some of the hypotheses:

Summer vacation:  This hypothesis holds that traders and investors are more likely to sell their stocks after returning from their August vacations or long, Labor Day weekends.  Trading volume tends to decline during the summer, and then investors – especially professional investors – get back to trading from their computers.

Third-quarter:  Many mutual funds have fiscal years ending in the fall, provoking them to sell their losing stocks for “window-dressing” purposes.  This term describes the process of a portfolio manager making cosmetic changes at the end of the quarter because they list their holdings at the beginning of a new quarter – their list of holdings looks better without the poor performing stocks.

Tax losses: Investors begin to sell declining stocks to harvest their tax losses, getting ahead of other investors who sell at year-end.  This hypothesis also draws support from the observed “January effect,” where investors buy back the stocks that they sold for tax purposes. 

Tuition time:  With this hypothesis, many investors must sell large amounts of their stock holdings to pay their children’s tuition bills at colleges, universities, and prep schools.  And for most, the school year begins roughly in September.

Seasonal Affective Disorder (SAD):  A university study suggested that the sharp drop in the amount of daylight in New York City in September might trigger Seasonal Affective Disorder (SAD), a type of depression related to changes in seasons.  As a result, according to this hypothesis, some investors become more risk-averse, so they sell losing stocks, unwilling to wait for things to get better. 

Cultural trends (summer vacations, back-to-school in the fall), regulations and taxes (third quarter, tax losses), and even psychological effects of weather (seasonal affective disorder) have been offered as explanations for this strange September market trend. Unfortunately, none of these explanations has been proven, frustrating researchers who seek reasons for patterns in the stock market.  Maybe each of these factors contributes to the trend.  No one really knows the reason for the September Swoon.

Should You Change Your Portfolio?

If someone discovered a convincing explanation for the September Swoon, would this help investors?  Probably not.  Savvy investors might jump the gun, selling stocks in August, and then others might try to beat them by selling in July.  Of course, the seasonal September pattern would then disappear, replaced by some other trend. 

But even if there is no proven reason for this September Swoon, shouldn’t an investor make changes, anyway?  Because of this seasonal trend toward declining stock values in September, traders and investors might be inclined to alter their portfolios.

However, the September Swoon is based on an average, the average monthly performance of the stock market since before the Great Depression.  While September is, on average, the worst month for stocks, this doesn’t mean that each individual September is bad.  In fact, this “September Swoon” notion did not hold true in 2019, 2018, or 2017 (2016 was down 0.12%). No one knows the definite reason for this 90+-year “September Swoon”, so trying to guess which year will be bad is a fool’s game. 

Seasonality vs. Market Timing

Remember, there is a difference between market timing and seasonality.  Seasonal trends reflect how the market will behave in particular months as part of a long-term trend.  Market timing is based on short-term price patterns.  Timing the market perfectly is, of course, impossible.  As discussed above, seasonal trends are grounded in the analysis of years of data, but not every year is identical. 

It is important to remember that investors who trade frequently spend more time and pay more commissions, but they do not necessarily make more money.  The buy-and-hold strategy might be best for you. A knowledgeable financial advisor who understands you and your goals can help.

Partnering with Outside The Box Financial Planning offers numerous benefits for individuals seeking retirement planning, small business support, wealth management, and beyond.  With their fiduciary duty, comprehensive approach, unbiased advice, transparent fee structure, and ongoing support, OTBFP act as a trusted advisor who prioritizes your best interests. Click here to schedule a complimentary “Fit” meeting to determine if we would make a good mutual fit.

Remember, financial decisions have long-lasting implications, and working with a professional can provide the expertise and guidance necessary to make informed choices that align with your financial aspirations. 

However, if you would like to take a shot at building a financial plan on your own, we offer our financial planning software, RightCapital, free of charge. Click here to get started.

CARES Act Benefits For Businesses

CARES Act Benefits For Businesses  

CARES ACT Benefits For Businesses.png

The Coronavirus Aid, Relief, and Economic Security act – the CARES Act – is the largest economic bill in U.S. history and was designed to “provide emergency assistance and health care response for individuals, families, and businesses affected by the 2020 coronavirus pandemic.”

Spanning close to 900 pages, the CARES Act builds upon earlier versions of federal government support and is the third such bill, coming shortly after the “Coronavirus Preparedness and Response Supplemental Appropriations Act” and the “Families First Coronavirus Response Act” were approved.

Here are a few highlights that might be of interest to business owners, but it’s important to remember that not all provisions of the CARES Act are available to every business.

Protecting Paychecks

The Paycheck Protection Program offers loans to small businesses that are fully guaranteed by the federal government. The loans are designed to cover eight weeks of operating costs during the crisis – so that means covering payroll and the costs of rent, utilities, mortgage interest, etc. These loans may be fully forgiven so long as the business complies with the federal government rules.

Employee Retention Tax Credit

A refundable payroll tax credit up to $5,000/employee. But in order to qualify, a business must have closed completely/partially, or revenues had to have declined by more than 50% relative to the same time last year.

Sick and Family Leave Tax Credits

Credits for sick and family leave costs for businesses with fewer than 500 employees. Businesses with no employees (sole proprietors) are eligible to receive refundable tax credits as well.

Deferral of Social Security Taxes

Businesses can defer payment of the employer share of Social Security tax incurred from March 27th through December 31st, but the deferred taxes must be paid over two years.

It’s Complicated

As a business owner, you’ll have choices to make when deciding which benefit to use. For example, a business cannot apply both the Paycheck Protection program and the employee retention tax credit. There are a lot of nuances within the CARES Act to think through. Set up a CARES Act Benefits Consultation by clicking here or email me at ivan@otbfinancialplanning.com to see how these may apply to you.

Ivan Havrylyan
CARES Act Benefits For Individuals

CARES Act Benefits For Individuals

Cares Act.png

The Coronavirus Aid, Relief, and Economic Security act – the CARES Act – is the largest economic bill in U.S. history and was designed to “provide emergency assistance and health care response for individuals, families, and businesses affected by the 2020 coronavirus pandemic.”

Spanning close to 900 pages, the comprehensive aid package covers a lot, including direct payments to Americans, expanded unemployment insurance, changes to retirement rules and billions of dollars in aid to businesses.

The CARES Act builds upon earlier versions of federal government support and is the third such bill, coming shortly after the “Coronavirus Preparedness and Response Supplemental Appropriations Act” and the “Families First Coronavirus Response Act” were approved.

Here are a few highlights that might be of interest to individuals:

Rebate for Individuals

The bill would provide a $1,200 refundable tax credit for individuals ($2,400/joint). Additionally, taxpayers with children will receive a flat $500 for each child. The rebates would not be counted as taxable income.

The rebate does phase out as follows:

  • Starts to phase out at $75,000 for singles and completely gone at $99,000

  • Starts to phase out at $150,000 for married joint filers and completely gone at $198,000

  • Starts to phase out at $135,000 for a head of household filers

Unemployment Expansion

Unemployment insurance assistance now includes an additional $600 per week payment to each recipient for up to four months plus extend benefits to self-employed workers, independent contractors, and those with limited work history. The government will provide temporary full funding of the first week of regular unemployment for states with no waiting period and extend benefits for an additional 13 weeks through December 31, 2020.

Waiver of 10% Withdrawal Penalty

The 10% penalty for early withdrawals from IRAs and retirement accounts is being waived for 2020, subject to a maximum allowable withdrawal of $100,000.

Withdrawal amounts are taxable over three years, but taxpayers can recontribute the withdrawn funds into their retirement accounts for three years without affecting retirement account caps.

Required Minimum Distributions

For 2020, individuals expected to take Required Minimum Distributions will not be required to withdraw that amount from their IRA or retirement plan.

Coronavirus-Related Distributions

The CARES Act allows for “Coronavirus-related Distributions” which allow participants in IRAs and retirement plans the ability to take a qualifying withdrawal and pay those funds back without tax or interest over a 3-year period. The withdrawal is subject to a $100,000 limit.

There are qualifications for Coronavirus-Related Distributions, however, including:

  • Personal, spouse or dependent diagnosis with COVID-19

  • Quarantined, furloughed, laid off, or work hours reduced because of COVID-19

  • Unable to work due to lack of childcare due to COVID-19

  • Own a business that is closed or shortened hours due to COVID-19

  • Other factors later specified by the IRS

Retirement Loans

For those unable to meet the Coronavirus-Related Distributions criteria, withdrawals from retirement plans in the form of a loan exists.

Generally speaking, those loans need to be repaid over 5 years and cannot exceed $50,000 or half the vested account value, whichever is less. Now, however, the amount is doubled so that one can take a loan up to $100,000 or half of the vested account value, whichever is less. The loan still needs to be repaid, but payments can be deferred up to 1 year after the loan is taken.

Your Financial Advisor

As with all federal government programs, there are rules, deadlines, and qualifications that can be difficult to decipher. The fact is that while this is by far the largest economic bill in America’s history, it is near impossible for any bill to take into account every unique situation.

So, before you go down a path that might not be in your best interest, set up a CARES Act Benefits Consultation by clicking here or email me at ivan@otbfinancialplanning.com.

This is especially important as the CARES Act is bill number three. And Washington has been talking about bill number four, which will undoubtedly bring more economic relief and changes.

Could Current Market Pullbacks Be Opportunities?
11363.jpg

How this late-winter, coronavirus-induced market turbulence affects you depends upon how old you are. For people in or near retirement, it is scary – yet there are ways to offset a shrinking stock portfolio. Regardless of your age, look at market dips as opportunities, not threats.

Eleven Trading Days for the Record Books

For the last part of February and at least through the first third of March, the stock market could be described as “tumultuous.” The S&P 500 Index, the DJIA and NASDAQ are all off more than 10% from recent highs.

The nasty coronavirus is somewhat to blame, but that would be much too simple:

·       Oil was in free-fall

·       The Federal Reserve cut rates by 25 basis points in an emergency meeting

·       Fed-watchers think another 100 basis point rate cut is coming, pushing rates to almost 0

·       Every single one of the 11 S&P 500 sectors is in the red YTD, with the Energy sector off over 40% and the Financials and Materials sectors off over 20% YTD

And here are some history-making days to think about: from February 24th through March 9th, there were 11 trading days:

·       Those 11 trading days saw 5 of the 7 largest one-day-point-losses for the DJIA in history

·       Those 11 days also saw the two best-one-day-point-gains for the DJIA in history too

Now Might be a Good Time to Invest

How such market action, which is normal, impacts you financially and psychologically depends on where you are, age-wise. If you are younger and have long investment time frames relative to your goals, a market dip can be your friend. For example, let’s say you have young children and are saving for them in a 529 college savings plan, and college is a number of years away. If your account is down along with the market, compared to a previous high point, consider adding money.

Ditto if you are saving for retirement in a 401(k), individual retirement account or similar plan. If you save regularly, dollar cost averaging works. That’s where you invest a set amount on a regular schedule, perhaps at the first of each month. When stocks decline your contribution buys more cheaper shares and less expensive shares. Over time your average share cost is less than the current share price.

Is Opportunity Knocking?

If you are retired or some other life event has forced you to live off of your savings, naturally, you are nervous amidst scary headlines and histrionics of media commentators during significant market declines.

But consider heeding the words of the legendary investment manager John Templeton, who famously counseled, “Buy when there is blood in the streets.”

Occasionally you get event-driven market routs such as the aftermath of 9/11 in 2001 and the debt crisis of 2008. In your life span as an investor, you have hopefully saved for rainy days, kid’s educations, future retirement and life-enriching experiences like global travel. When markets dropped, you should have dropped in extra funds. It’s likely that you never bought at the bottom, as that is obvious only with 20/20 hindsight.

Your Investment Policy is Critical

The key is a sound investment policy that allows a cushion – in money market funds or other safe and low-volatility repositories that provides living expenses without having to sell stocks at low levels. Alternative investments in real estate, private equity and financing, energy infrastructure, etc., may also provide cash flows to supplement living needs without selling stocks.

You also may focus on value stocks with good dividends and reasonable P/E ratios. Such portfolios eschew aggressive growth stocks that pay no dividends and have no profits. A hot story may sell, but do economic fundamentals underpin the stock value?

Big Picture

No one likes to see markets continuing to set one-day point-drop records. And while the media continues to scream that the sky is falling, it’s not.

Remember that through the first few months of 2020, we see:

  • Low and declining energy costs

  • Low and declining interest rates

  • Low inflation rates

  • Easy monetary policy

  • Low unemployment (50-year low)

  • A stable housing market

The sky is not falling as winter 2020 comes to a close. But rain clouds and storm fronts can be vexing, unless you are prepared with rain gear. A comprehensive investment policy is the financial planning equivalent of rain gear. You may not be singing in the rain, but you will maintain peace of mind.