Navigating Your Financial Health: A Roadmap to Debt Management for Health Professionals

Imagine you’re a skilled health professional, well-versed in the intricacies of patient care, yet finding yourself a bit overwhelmed by the complexities of managing personal finances. Navigating your financial health, much like treating a patient, requires a detailed understanding of the problem, a strategic approach, and ongoing adjustments to ensure the best outcomes. In this case, understanding your debt structure is like having a detailed medical chart – it's crucial for diagnosing the situation and planning the right course of action. In this journey towards financial stability, you’ll encounter different types of debt: mortgages, student loans, and credit card debt, each playing a vital role in shaping your financial well-being. So, how do you effectively manage these financial obligations? Let's delve into some practical strategies crafted to help you manage debt and achieve financial freedom, much like following a well-planned treatment protocol.

Assessing Your Debt Structure: The Initial Diagnosis

Just as you would assess a patient's overall health before deciding on a treatment plan, begin by taking stock of your current debt scenario. Your debt structure comprises various financial obligations such as mortgages, car payments, student loans, and credit card debt. List them all out, noting the interest rates and repayment terms for each. This assessment is your diagnostic tool, akin to a comprehensive medical chart that guides the formulation of a treatment plan. By understanding the specifics of your debt – the interest rates, repayment terms, and total amounts owed – you can craft a strategic debt management plan tailored to your situation.

Prioritize Your Financial Goals: Setting Treatment Priorities

Think of your financial goals as treatment priorities. Just as in medicine, where certain conditions must be addressed before others, your financial goals should be prioritized. Establish clear objectives – whether it’s building an emergency fund, saving for retirement, or funding your children’s education. These goals will direct your debt repayment efforts and wealth accumulation strategies. Aligning your debt management with these priorities ensures you stay focused and motivated, much like following a treatment plan designed to address the most critical health issues first.


Once your financial priorities are funded, you can use the remaining income for discretionary spending, similar to how you might manage a patient’s treatment around essential and non-essential interventions.
— Ivan havrylyan

Creating a Budgetary Blueprint: Your Financial Treatment Plan


A well-defined budget is like a detailed treatment plan, guiding your financial decisions and ensuring you allocate resources efficiently. Adopt a top-down approach to budgeting, where you first allocate funds toward your financial priorities.

For example, if your goal is to save $30,000 annually for retirement and emergency funds, earmark a specific amount each month towards these objectives. Once your financial priorities are funded, you can use the remaining income for discretionary spending, similar to how you might manage a patient’s treatment around essential and non-essential interventions.

Tracking Your Progress: Regular Check-Ups


Consistent monitoring is crucial in both medicine and finance. Regularly review your budget, spending patterns, and debt repayment milestones. This is akin to scheduling regular check-ups to ensure the treatment is working and to make necessary adjustments. By tracking your financial progress, you can identify deviations from your plan early and take corrective action. This proactive approach helps you stay on course toward your financial goals, much like adjusting a treatment plan based on patient response.


Addressing Roadblocks and Challenges: Overcoming Financial Ailments

Just as patients may encounter complications, you may face financial roadblocks. These could be unexpected expenses, fluctuating interest rates, or lifestyle creep. It’s essential to anticipate and address these hurdles proactively.

Evaluate your spending habits, identify areas where you can cut back, and reassess your financial priorities if necessary. Adopting a flexible approach, much like adjusting a treatment protocol to better suit a patient’s changing needs, will help you overcome obstacles and stay on track towards your goals.


Seeking Professional Guidance: Consulting Financial Specialists

Navigating debt management can be daunting, much like diagnosing a complex medical condition. Seeking guidance from financial professionals – be it a financial planner, debt counselor, or investment advisor – can provide you with the expertise and personalized advice you need. Just as you would consult a specialist for a complicated health issue, leveraging professional expertise can streamline your journey towards financial stability. They can offer tailored solutions and strategies to manage your debt effectively, ensuring you’re making informed decisions.

Remember, the path to financial freedom begins with informed decision-making and disciplined financial habits.
— ivan havrylyan

Conclusion: Achieving Financial Wellness

Mastering debt management is essential for financial success, empowering you to take control of your financial future and achieve lasting prosperity. By assessing your debt structure, prioritizing your financial goals, creating a budgetary blueprint, tracking your progress, addressing challenges, and seeking professional guidance, you can navigate through the complexities of debt management with confidence. Remember, the path to financial freedom begins with informed decision-making and disciplined financial habits. Start your journey today with the financial guidance of Outside The Box Financial Planning, much like a well-planned treatment regimen, and pave the way towards a brighter financial future.


Partnering with Outside The Box Financial Planning (OTBFP) offers numerous benefits for individuals seeking college planning, retirement planning, small business support, wealth management, and beyond.  As a fee-only fiduciary with a comprehensive approach, unbiased advice,  and transparent fee structure, OTBFP acts as a trusted advisor who prioritizes your best interests. Click here to schedule a complimentary “Fit” meeting to determine if we would make a good mutual fit.

Remember, financial decisions have long-lasting implications, and working with a professional like the financial professionals of Outside The Box Financial Planning can provide the expertise and guidance necessary to make informed choices that align with your financial aspirations.


The Top 5 Things You Should Know About Your 401(k) Benefits

In the grand scheme of personal finance, your 401(k) is like a hidden treasure chest waiting to be discovered. It's not just a retirement account; it's your key to financial freedom and security. While you may have heard the term "401(k)" thrown around in conversations about the future, have you ever really dug deep to understand what it's all about?

Let’s unravel the mysteries of the 401(k) mysteries and unveil the top five things you need to know to make the most of this powerful tool. Whether you're a nurse at Advocate Lutheran General Hospital looking to maximize your 401k contributions or a seasoned professional nearing retirement looking for tax-efficient savings strategies, understanding your 401(k) is the roadmap to a more secure and prosperous retirement.

First, let's clarify what a 401(k) is. Simply put, a 401(k) is a tax-advantaged retirement account offered by many employers, allowing you to set aside a portion of your income for the golden years.

1. Types of 401(k) Plans and Their Tax Benefits:

There are two basic types of 401(k) plans that exist: a Traditional 401(k) and a Roth 401(k). These two options have different tax implications - that impact you both now and in the future. Both have their advantages and disadvantages. Whether you choose a traditional 401(k) or Roth 401(k) plan, both have annual contribution limits that are set by the IRS. For 2023, the limit is $22,500 for individuals under 50, with an additional $7,500 catch-up contribution allowed for those 50 and older. 

With a Traditional 401(k), your contributions are made from pre-tax income and lower your current year’s taxable income, potentially even putting you in a lower tax bracket, thereby saving you money. This reduces your taxes today and allows your 401k to grow without worrying about paying the taxes as you go. However, when you withdraw the money in retirement, you will be taxed on a larger total sum of money as you take distributions, assuming your investments have performed well.

In contrast, a Roth 401(k) is funded with after-tax income, meaning you won't get a tax break today, but your withdrawals in retirement are tax-free.

The choice between the two depends on your current and future financial situation and tax expectations. Because of the trade-offs between these two options, it’s crucial to analyze your own personal situation to determine which will be optimal for you. If you’re having trouble calculating which is best for you, you should consult a Certified Financial Planner, like Outside the Box Financial Planning, to help you understand how to maximize your retirement accounts.

2. Matching Contributions from your Employer:

Many employers offer a valuable benefit – the 401(k) match. This means that your employer contributes a certain percentage, usually 3%, of your total salary to your 401(k) account. Some employers may offer more than 3%, which can be a huge perk since that obviously means more money will be matched to your contributions.

It's essentially “free money” contributions made to your retirement savings account that you’ll want to make sure you do not miss out on. Make sure you fully understand your employer's matching policy and strive to contribute at least the same percentage that your employer offers to maximize their match. It's one of the easiest ways to boost your retirement savings.

3. An Automated Savings Mechanism:

By its very nature, a 401(k) is an automated savings mechanism, and its power lies in its seamless, set-it-and-forget-it approach. It’s deducted from your salary before it ever reaches your bank account, making it easy and hassle-free. It's deducted automatically from your paycheck before you ever have a chance to spend it!

This is a lifesaver for many people, as it helps them establish good savings habits. The automated nature of this savings mechanism simplifies your journey toward a comfortable retirement, making it easy to save and invest for the future, even with a busy life. So, embrace your 401(k) as your diligent financial partner, and let it work its magic in the background, growing your wealth while you focus on the present. Your future self will thank you for it.

4. Investment Options:

Your 401(k) typically offers a menu of 20 or so investment options, typically in the form of mutual funds, exchange-traded funds (ETFs), and other investment vehicles. Most of these are the standard options that have to be suitable for all of the participants but, as a result, may not be optimal for you. This is why working with a finance professional to build a comprehensive investment strategy incorporating all your accounts and using strategies to mitigate the 401k limited options risk is essential to a sound investment portfolio.

At Outside The Box Financial Planning, we offer Comprehensive Financial Planning and Wealth Management services and work closely with our clients to coordinate all of their investments, custom tailoring their portfolios to meet their retirement goals and objectives.

5. Early Withdrawal Penalties, Vesting and Leaving Your Job:

While your 401(k) is designed for retirement savings, emergencies can sometimes lead to you needing to withdraw some of the funds in your 401k prior to retirement. However, early withdrawals before the age of 59½ are fully taxable and subject to an additional 10% early withdrawal penalty. There are some exceptions to te rule; however, understanding the rules and potential consequences is vital to making an informed financial decision.

If you change jobs or retire, you may have an option of either keeping your 401k with your former employer or transferring it either to your new employer or into an Individual Retirement Account (IRA). Each option can have its own advantages and disadvantages.

Vesting is a critical concept in 401(k) plans. It refers to your ownership of employer-contributed funds over time. If you leave your job before you're fully vested, you may forfeit a portion of your employer's contributions. Each 401k plan has its own vesting schedule; understanding yours is crucial to making sure you don’t forfeit any contributions. When switching jobs, it may be a good idea to review your vesting schedule to make sure you make the right decision.

In conclusion, your 401(k) is an invaluable tool for securing your financial future. Understanding its ins and outs is crucial for making the most of this retirement savings vehicle. From the automated savings mechanism it offers to the nuances of contribution limits, tax implications, and the impact of legislation like the SECURE Act 2.0, there are numerous factors to consider.

Working with a fee-only, Certified Financial Planner can result in personalized guidance and custom-tailored financial plan to your unique goals.

Your 401(k) is a significant part of your financial picture, and making informed decisions about it will set you up for a comfortable and prosperous retirement. Remember, your future self will thank you for the diligence and care you put into understanding and managing your 401(k).


Partnering with Outside The Box Financial Planning offers numerous benefits for individuals seeking college planning, retirement planning, small business support, wealth management, and beyond.  As a fee-only fiduciary with a comprehensive approach, unbiased advice, and transparent fee structure, OTBFP acts as a trusted advisor who prioritizes your best interests. Click here to schedule a complimentary “Fit” meeting to determine if we would make a good mutual fit.

Remember, financial decisions have long-lasting implications, and working with a professional can provide the expertise and guidance necessary to make informed choices that align with your financial aspirations. However, if you would like to take a shot at building a financial plan on your own, we offer our financial planning software, RightCapital, free of charge. Click here to get started.

Ivan Havrylyan
Q3 2023 Quarterly Market Commentary

Markets Have Rotten Third Quarter

Global equity markets had a rotten third quarter – especially the smaller-cap and tech names. And the month of September was especially difficult, as volatility increased, oil jumped and the S&P 500 closed out September with 4 consecutive losing weeks.

For the third quarter of 2023:

  • The DJIA retreated 2.6%;

  • The S&P 500 lost 3.7%;

  • NASDAQ declined 4.3%; and

  • The Russell 2000 dropped 5.9%.

While there was not a lot to celebrate when the third quarter closed, investors are still somewhat encouraged by the YTD numbers as the major equity markets are still in positive territory, albeit barely for the smaller-caps and the mega-caps as:

  • The DJIA up 1.1% YTD%;

  • The S&P 500 up 11.7% YTD;

  • NASDAQ up 26.3% YTD; and

  • The Russell 2000 up 1.4% YTD.

The themes that drove market performance in the third quarter continued to center around inflation, the Fed, the housing market, and the labor market, as recent numbers suggested that inflation is easing as the Fed paused its rate-hiking trend (at least for now). There was also a lot of encouraging economic data received this quarter as well, including hopeful GDP numbers and consumer sentiment levels.

Further, we saw that:

  • Volatility, as measured by the VIX, trended up this quarter, beginning the quarter at 13.5 and ending at 17.5, with most of the increase beginning at the end of September.

  • West Texas Intermediate crude trended up significantly for the third quarter, jumping over $20/barrel from about $70 to over $90, peaking at $93.68/barrel and stoking inflation.

Market Performance Around the World

Investors were unhappy with the quarterly performance around the world too, as all 36 developed markets tracked by MSCI were negative for the third quarter of 2023, with 18 losing more than 6%. And for the 40 developing markets tracked by MSCI, only 4 of those were positive, with a great many losing more than 5%.

Sector Performance Rotated in 3Q2023

The overall performance for sector performance for the third quarter was poor. In fact, only two sectors advanced as the other 9 sectors declined markedly. Contrast that with the overall performance for sector performance for the second quarter of 2023, which was very good, as 9 of the 11 sectors advanced, with 3 jumping more than 15% .

And interestingly, with the exception of the Energy sector, the other 10 sectors saw relative performance decline from the second quarter to the third quarter, with a few sizable declines – like Information Technology going from +20% to -6% in just a quarter.

Here are the sector returns for the third and second quarters of 2023:

Reviewing the sector returns for just the 3rd quarter of 2023, we saw that:

  • 9 of the 11 sectors were painted red, with the Energy sector making a big leap, driven by rising oil prices;

  • The defensive-sectors (think Utilities and Real Estate) really struggled during the quarter;

  • Information Technology saw an especially huge swing and half of the sectors lost more than 5%; and

  • The differences between the best (+12%) performing and worst (-9%) performing sectors in the first quarter was massive.

2Q2023 GDP Up 2.1%

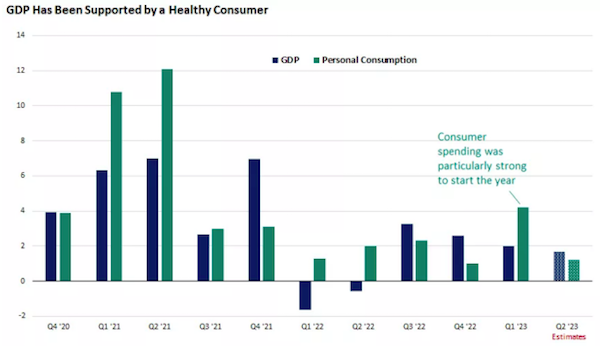
The Bureau of Economic Analysis Real reported that Gross Domestic Product increased at an annual rate of 2.1% in the second quarter of 2023. In the first quarter, real GDP increased 2.2%.

“The increase in real GDP reflected increases in nonresidential fixed investment, consumer spending, and state and local government spending that were partly offset by a decrease in exports. Imports decreased.

Compared to the first quarter, the deceleration in real GDP in the second quarter primarily reflected a deceleration in consumer spending, a downturn in exports, and a deceleration in federal government spending that were partly offset by an upturn in private inventory investment, an acceleration in nonresidential fixed investment, and a smaller decrease in residential investment. Imports turned down.”

Fed Holds Rates Steady – For Now

Wall Street and Main Street toggled between hope that the Fed might be done with its rate-hiking and worry from the Fed’s recent and very hawkish comments from its last meeting. And as expected, the big news on the quarter was that the Fed decided to leave its fed funds rate (its short-term lending benchmark) at a target range of 5.25% to 5.50%, the same level established at its July meeting.

But confounding Wall Street was the Fed’s updated Summary of Economic Predictions where another rate hike this year was very much on the table. In addition, the Fed surprised many with an outlook for rates next year that were notably higher than expected as were their 2025 rate predictions.

Inflation Still High

The Consumer Price Index for All Urban Consumers rose 0.6% in August on a seasonally adjusted basis, after increasing 0.2% in July, the U.S. Bureau of Labor Statistics reported. Over the last 12 months, the all items index increased 3.7% before seasonal adjustment.

  • The index for gasoline was the largest contributor to the monthly all items increase, accounting for over half of the increase.

  • Also contributing to the August monthly increase was continued advancement in the shelter index, which rose for the 40th consecutive month.

  • The energy index rose 5.6% in August as all the major energy component indexes increased.

  • The food index increased 0.2% in August, as it did in July.

  • The index for food at home increased 0.2% over the month while the index for food away from home rose 0.3% in August.

  • The index for all items less food and energy rose 0.3% in August, following a 0.2% increase in July.

  • Indexes which increased in August include rent, owners’ equivalent rent, motor vehicle insurance, medical care, and personal care.

  • The indexes for lodging away from home, used cars and trucks, and recreation were among those that decreased over the month.

  • The all items index increased 3.7% for the 12 months ending August, a larger increase than the 3.2% increase for the 12 months ending in July.

  • The all items less food and energy index rose 4.3% over the last 12 months.

The energy index decreased 3.6% for the 12 months ending August, and the food index increased 4.3% over the last year.

Consumer Confidence Declines Again

The Conference Board Consumer Confidence Index declined again in September to 103.0 (1985=100), down from an upwardly revised 108.7 in August. In addition:

  • The Present Situation Index – based on consumers’ assessment of current business and labor market conditions – rose slightly to 147.1 (1985=100) from 146.7.

  • The Expectations Index – based on consumers’ short-term outlook for income, business, and labor market conditions – declined to 73.7 (1985=100) in September, after falling to 83.3 in August.

  • Expectations fell back below 80 – the level that historically signals a recession within the next year. Consumer fears of an impending recession also ticked back up, consistent with the short and shallow economic contraction we anticipate for the first half of 2024.

“Consumer confidence fell again in September 2023, marking two consecutive months of decline. September’s disappointing headline number reflected another decline in the Expectations Index, as the Present Situation Index was little changed. Write-in responses showed that consumers continued to be preoccupied with rising prices in general, and for groceries and gasoline in particular. Consumers also expressed concerns about the political situation and higher interest rates. The decline in consumer confidence was evident across all age groups, and notably among consumers with household incomes of $50,000 or more.”

Assessment of Family’s Current Finances

Consumers’ assessment of their Family’s Current Financial Situation turned more negative in September.

Existing Home Sales Drop

“NAR released a summary of existing-home sales data showing that housing market activity this August declined 0.7% from July 2023. August’s existing-home sales reached a 4.04 million seasonally adjusted annual rate. August’s sales of existing homes weakened by 15.3% from August 2022.

The national median existing-home price for all housing types reached $407,100 in August, up 3.9% from a year ago.

Regionally, all four regions showed price growth from a year ago in August. The Midwest had the most significant gain of 6.8%, followed by the Northeast with an increase of 5.8%. The South increased 3.2%, while the West region rose 1.0%.

August’s inventory of unsold listings as of the end of the month was down 0.9% from last month, standing at 1,100,000 homes for sale. Compared with August of 2022, inventory levels were down 14.1%. It will take 3.3 months to move the current inventory level at the current sales pace, well below the desired pace of 6 months. Inventory conditions continue to be a challenge for potential home buyers.  

It takes approximately 20 days for a home to go from listing to a contract in the current housing market. A year ago, it took 16 days.

From a year ago, all four regions had double-digit declines in sales in August. The Northeast had the most significant dip of 22.6%, followed by the Midwest, which fell 16.4%. The West decreased 15.7%, followed by the South, down 12.4%.   

Compared to July 2023, two of the four regions showed declines in sales. Only the Midwest had an incline of 1.0%. The West region had the biggest drop in sales of 2.6%, followed by the South with a dip of 1.1%. The Northeast region was flat from last month.  

The South led all regions in percentage of national sales, accounting for 45.5% of the total, while the

In August, single-family sales decreased 1.4%, and condominium sales were down 4.8% compared to last month. Single-family home sales were down 15.3%, while condominium sales fell 15.4% compared to a year ago. The median sales price of single-family homes rose 3.7% to $413,500 from August 2022, while the median sales price of condominiums increased by 6.2% to $333,900.”

Builder Confidence Wanes

This is on the heels of the National Association of Home Builders reporting that: “builder confidence in the market for newly built single-family homes in September fell five points to 45, according to the National Association of Home Builders (NAHB)/Wells Fargo Housing Market Index. This follows a six-point drop in August.

From the NAHB release: “As mortgage rates stayed above 7% over the last month, more builders are reducing home prices again to bolster sales. In September, 32% of builders reported cutting home prices, compared to 25% in August. That’s the largest share of builders cutting prices since December 2022 (35%). The average price discount remains at 6%. Meanwhile, 59% of builders provided sales incentives of all forms in September, more than any month since April 2023.”

Durable Goods Orders Up

New Orders New orders for manufactured durable goods in August, up five of the last six months, increased $0.5 billion or 0.2 percent to $284.7 billion, the U.S. Census Bureau announced. This followed a 5.6 percent July decrease.

  • Excluding transportation, new orders increased 0.4 percent.

  • Excluding defense, new orders decreased 0.7 percent.

  • Machinery, up four of the last five months, led the increase, $0.2 billion or 0.5 percent to $37.8 billion.

Investor Confidence Index Inches Up

State Street Global Markets released the results of the State Street Investor Confidence Index for September 2023.

“The Global Investor Confidence Index increased to 108.7, up 0.9 points from August’s revised reading of 107.8. The increase in Investor confidence was driven by a 11.0 point jump in Asian ICI to 112.6, and, to a lesser extent, a 0.8 point rise in North American ICI to 104.7. European ICI, meanwhile, declined 6.2 points to 97.5.”

Sources: conference-board.org; nar.realtor; census.gov; bls.gov; nahb.org; statestreet.com; msci.com;  fidelity.comnasdaq.com; wsj.com; morningstar.com; census.gov

Copyright © 2023 Financial Media Exchange LLC. All rights reserved.

Distributed by Financial Media Exchange.


Ivan Havrylyan